Fig. 6
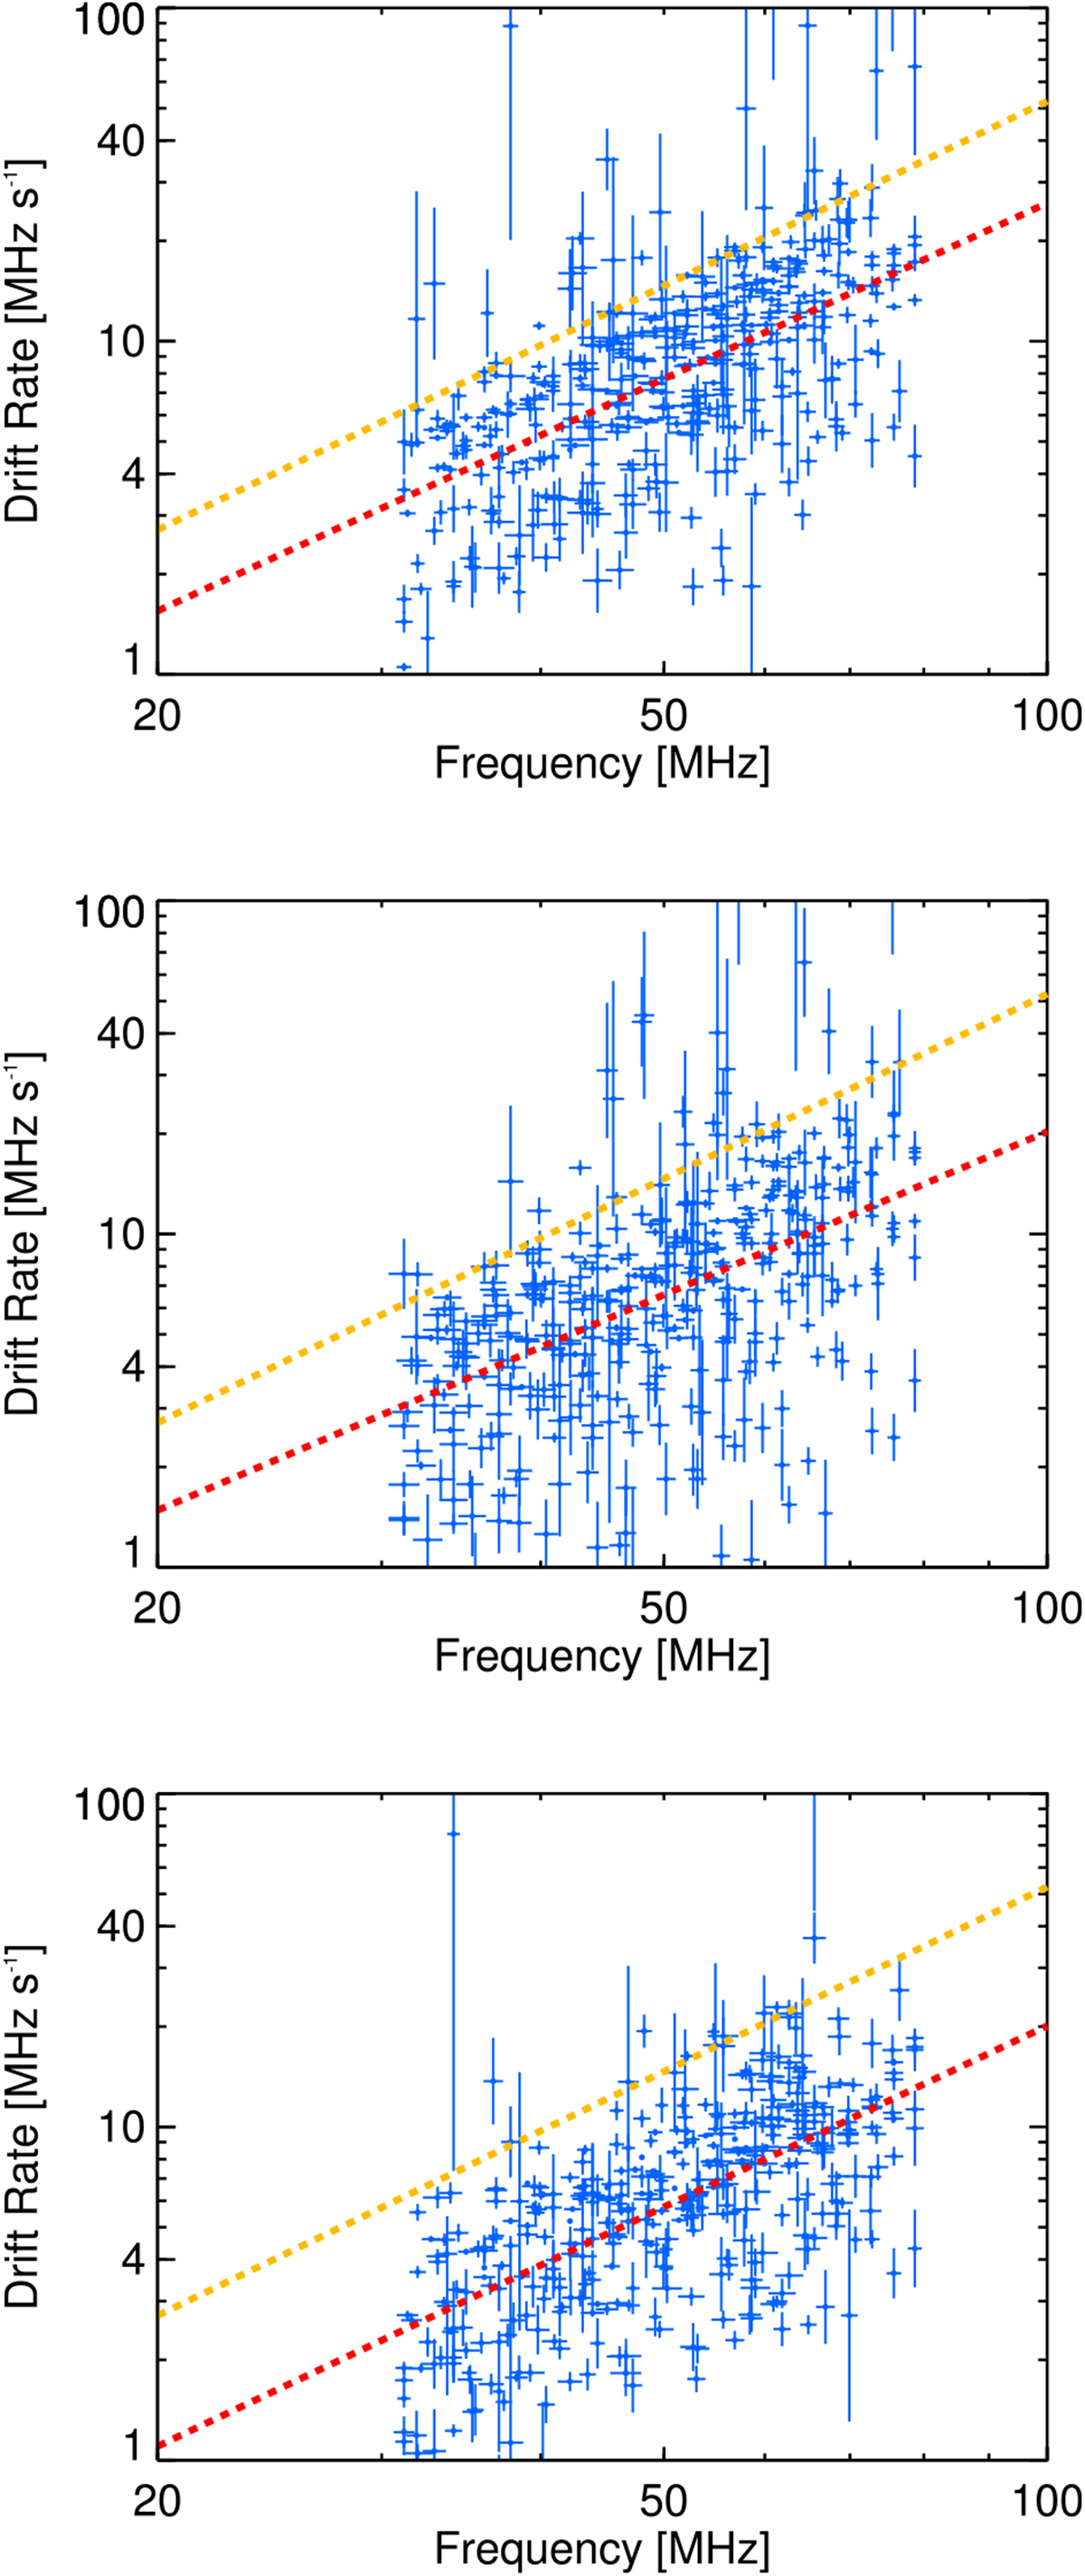
Drift rate as a function of frequency for all type III bursts for the rise (top), peak (middle), and decay (bottom) times. The red dashed line shows the fitted power-law to the data. The orange dashed line shows the fit from (Alvarez & Haddock 1973b). The reduced one-sigma errors are obtained from the fitting uncertainties in the drift rate, taking into account the fitting uncertainties in t0.
Current usage metrics show cumulative count of Article Views (full-text article views including HTML views, PDF and ePub downloads, according to the available data) and Abstracts Views on Vision4Press platform.
Data correspond to usage on the plateform after 2015. The current usage metrics is available 48-96 hours after online publication and is updated daily on week days.
Initial download of the metrics may take a while.