Fig. 2
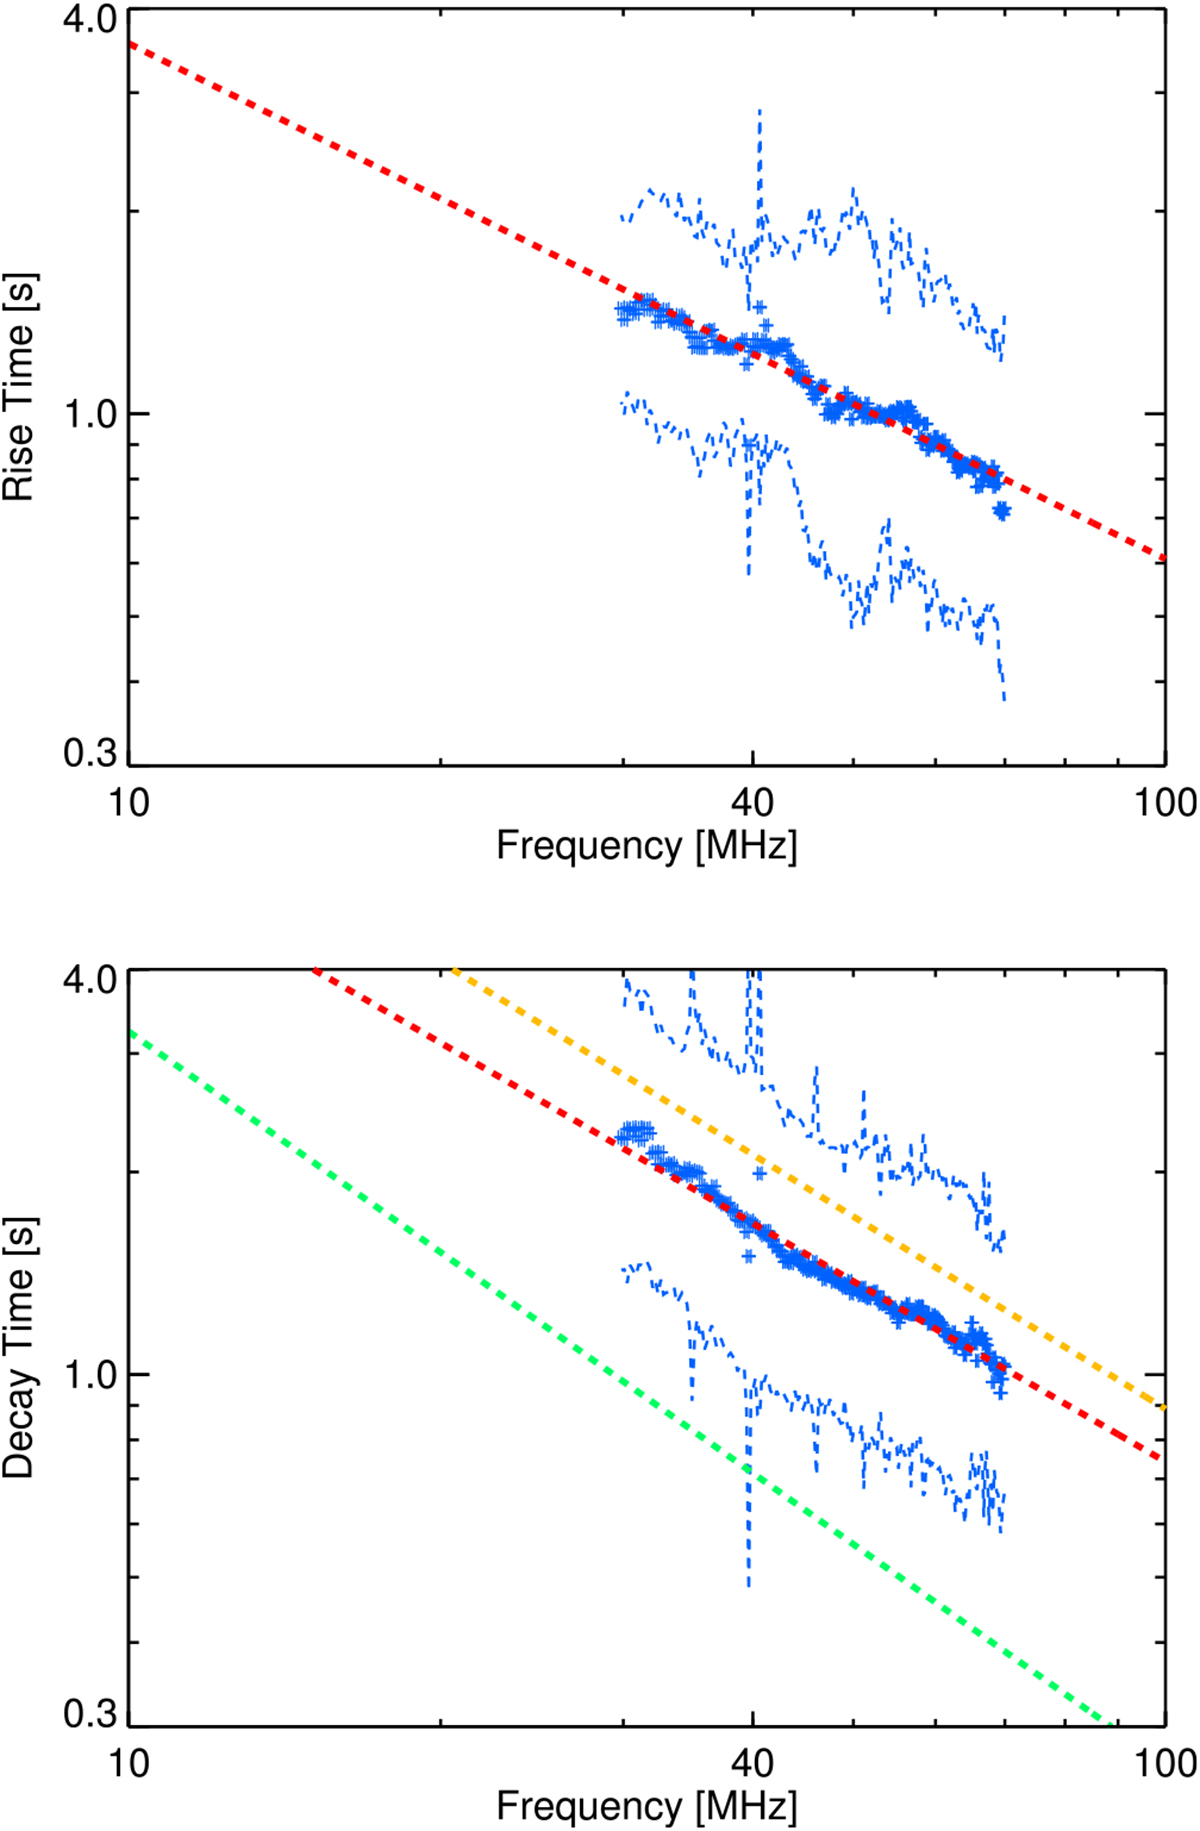
Mean rise time (top) and decay time (bottom) as a function of frequency for all the analysed type III bursts as found from the HWHM, tr and td, respectively. The top and bottom blue dashed lines show the spread of the data, found from the standard deviation. The red dashed line show the fits tr = (1.5± 0.1) f−0.77±0.14 and td = (2.2 ± 0.2) f−0.89±0.15 for frequency (per 30 MHz). For the decay time, the green and orange dashed lines show the fits from Evans et al. (1973) and Alvarez & Haddock (1973a), respectively, assuming a HWHM of td = τd log(2), from the derived exponential profiles τd.
Current usage metrics show cumulative count of Article Views (full-text article views including HTML views, PDF and ePub downloads, according to the available data) and Abstracts Views on Vision4Press platform.
Data correspond to usage on the plateform after 2015. The current usage metrics is available 48-96 hours after online publication and is updated daily on week days.
Initial download of the metrics may take a while.