Free Access
Fig. 9
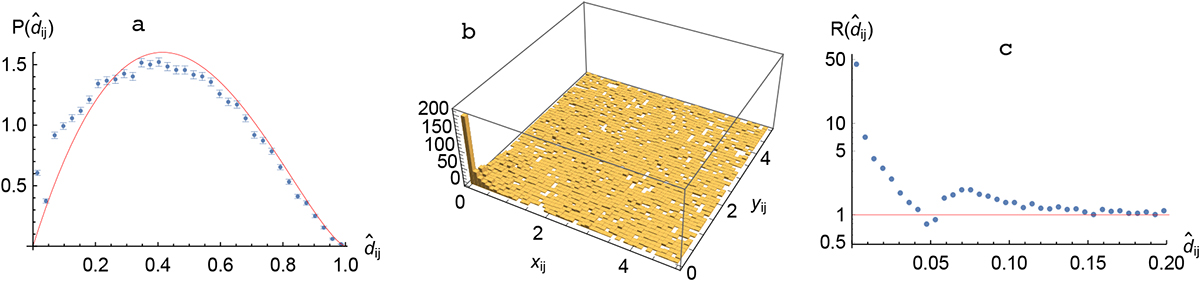
Distributions of angular distances in region C for G ≤ 15. The blue points in panel a represent the data on ![]() and the red curve is the result of a Monte-Carlo simulation. Panel b: 3D plot of distances xij, yij, their unit is 1′′ . Panel c: ratio of data to simulation from panel a.
and the red curve is the result of a Monte-Carlo simulation. Panel b: 3D plot of distances xij, yij, their unit is 1′′ . Panel c: ratio of data to simulation from panel a.
Current usage metrics show cumulative count of Article Views (full-text article views including HTML views, PDF and ePub downloads, according to the available data) and Abstracts Views on Vision4Press platform.
Data correspond to usage on the plateform after 2015. The current usage metrics is available 48-96 hours after online publication and is updated daily on week days.
Initial download of the metrics may take a while.