Fig. 2
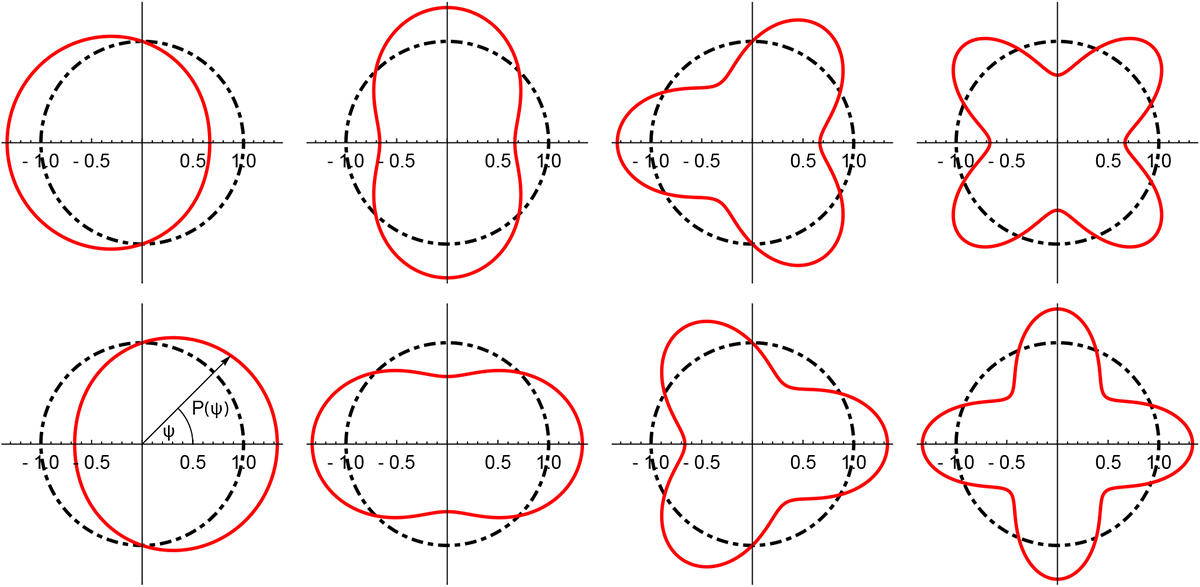
Examples of deviations from uniform angular distribution defined by Eq. (16). The red curves are their representation in polar coordinates (P(ψ), ψ) as indicated in the lower left panel. The panels from left to right correspond to n = 1, 2, 3, 4. The upper (lower) panels correspond to the negative (positive) sign of vn = ∓1∕6. The black dot-dashed circles correspond to uniform distribution P(ψ) = 1.
Current usage metrics show cumulative count of Article Views (full-text article views including HTML views, PDF and ePub downloads, according to the available data) and Abstracts Views on Vision4Press platform.
Data correspond to usage on the plateform after 2015. The current usage metrics is available 48-96 hours after online publication and is updated daily on week days.
Initial download of the metrics may take a while.