Free Access
Fig. 12
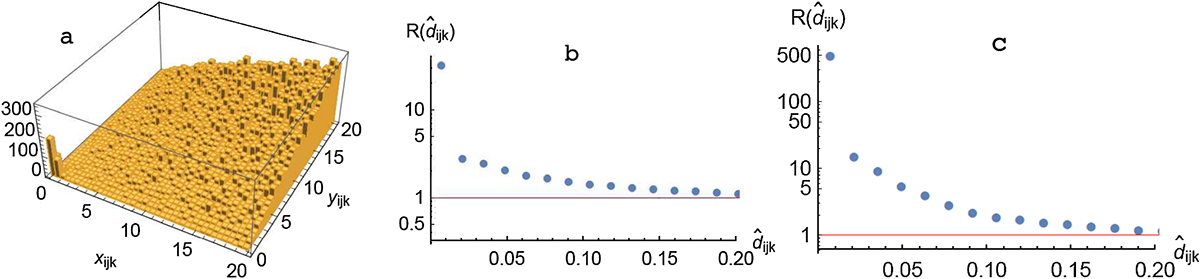
3D plot of angular ternary distances xijk, yijk
(unit is
1′′ ) in the region N&S for all G
(a) and ratios of measured distribution of relative distances ![]() to the interpolation of corresponding Monte-Carlo distribution for all G
(b) and G ≤ 18 mag (c).
to the interpolation of corresponding Monte-Carlo distribution for all G
(b) and G ≤ 18 mag (c).
Current usage metrics show cumulative count of Article Views (full-text article views including HTML views, PDF and ePub downloads, according to the available data) and Abstracts Views on Vision4Press platform.
Data correspond to usage on the plateform after 2015. The current usage metrics is available 48-96 hours after online publication and is updated daily on week days.
Initial download of the metrics may take a while.