Fig. 7
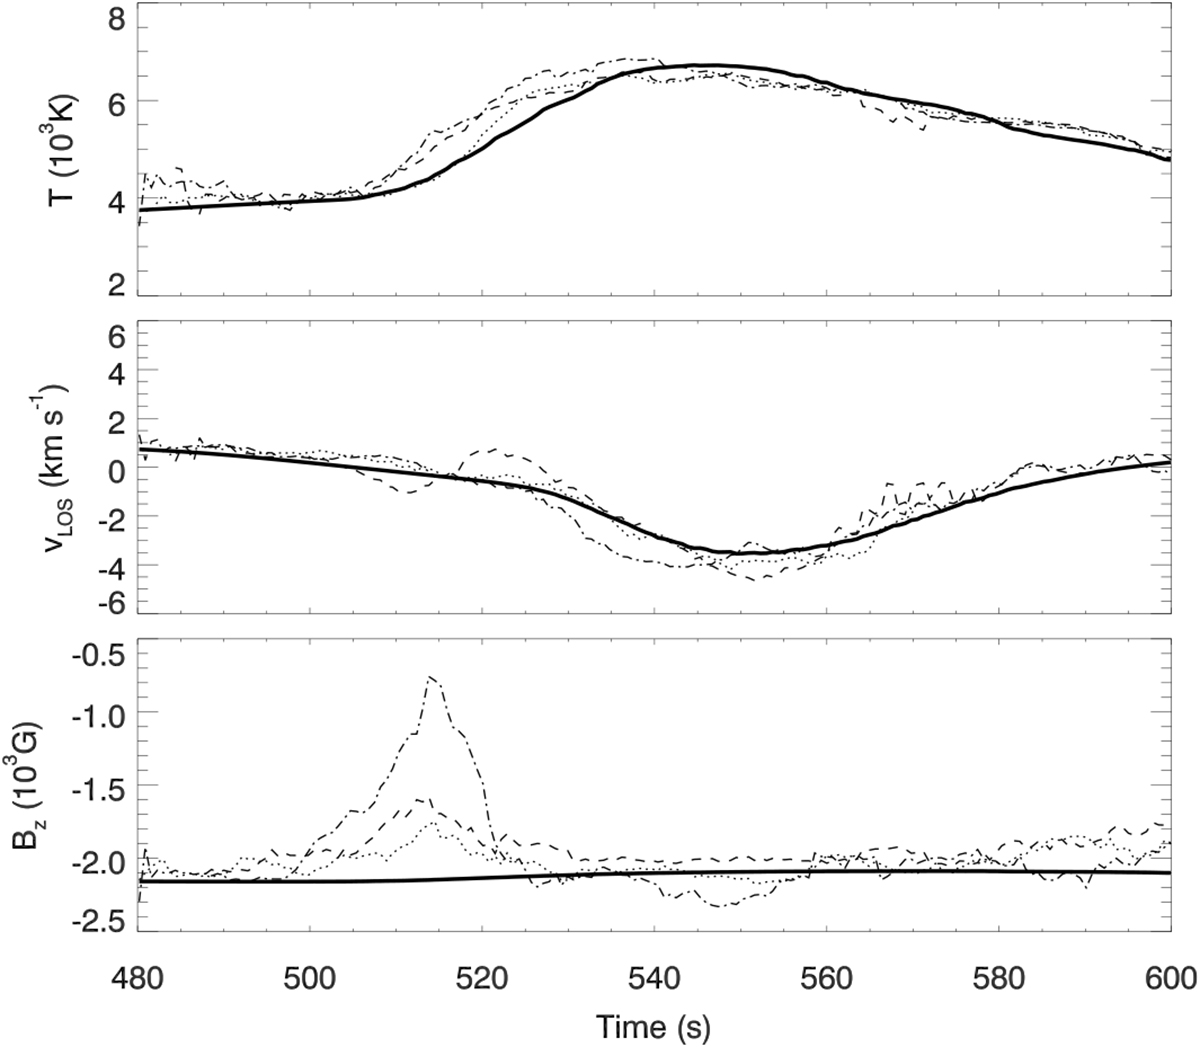
Temporal evolution of the temperature (top panel), LOS velocity (middle panel), and vertical magnetic field (bottom panel) at the chromosphere. Each panel illustrates the variable from the simulation (thick solid line), and the values inferred from the inversion of instantaneous profiles (dotted line), scanned profiles acquired from blue to red (dashed line), and scanned profiles acquired starting at the core (dash-dotted line).
Current usage metrics show cumulative count of Article Views (full-text article views including HTML views, PDF and ePub downloads, according to the available data) and Abstracts Views on Vision4Press platform.
Data correspond to usage on the plateform after 2015. The current usage metrics is available 48-96 hours after online publication and is updated daily on week days.
Initial download of the metrics may take a while.