Fig. 5
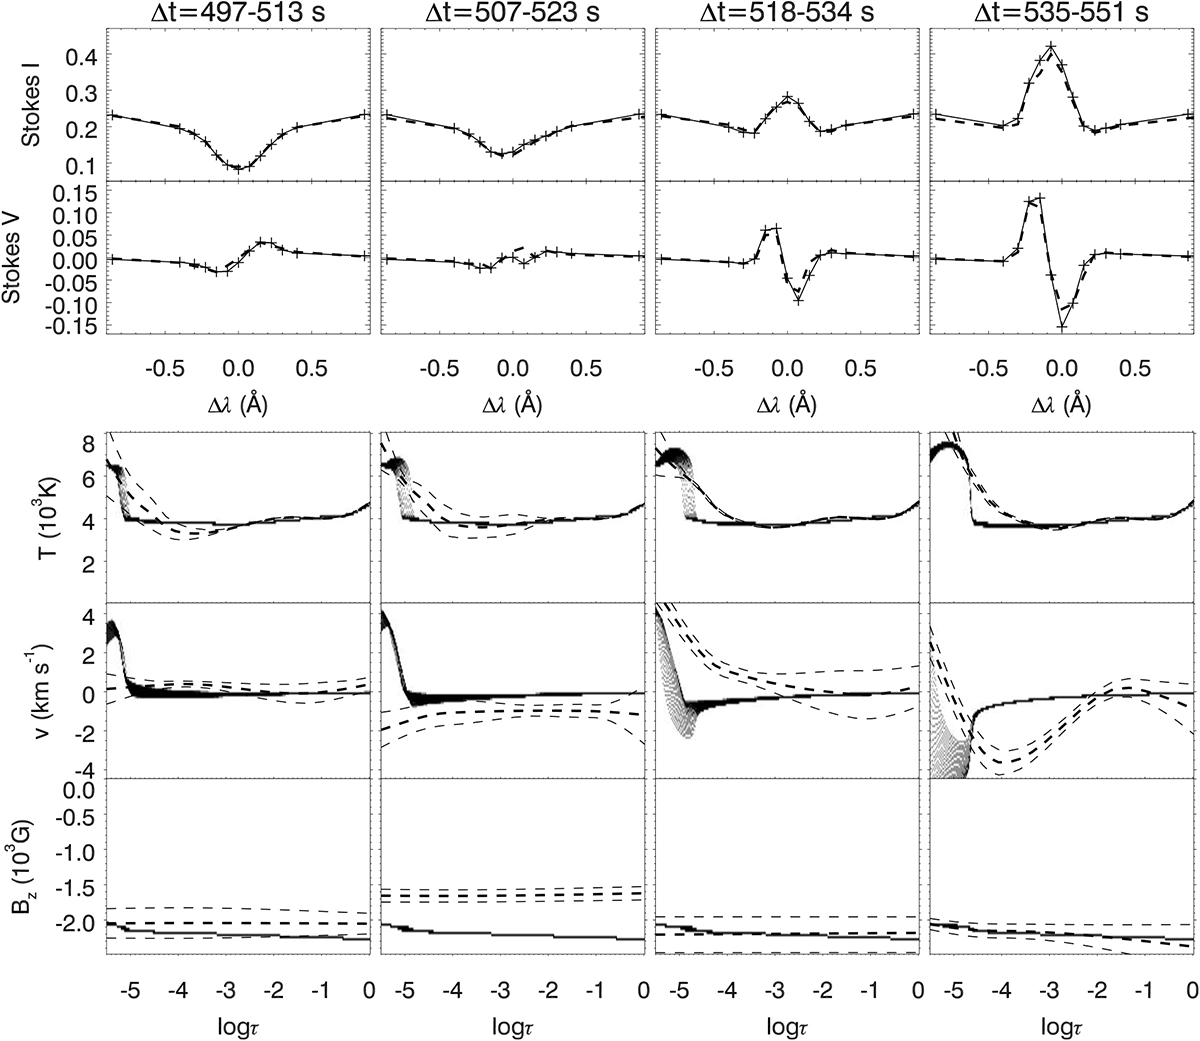
Same as Fig. 3 but for synthetic Stokes profiles with wavelengths acquired at different time steps as obtained from 2D instruments (scanned profiles). The scanning imitates that of de la Cruz Rodríguez et al. (2013). The three bottom rows show density maps of all the atmospheres taking place at that position during the temporal span of the scanning (indicated at the top of the columns).
Current usage metrics show cumulative count of Article Views (full-text article views including HTML views, PDF and ePub downloads, according to the available data) and Abstracts Views on Vision4Press platform.
Data correspond to usage on the plateform after 2015. The current usage metrics is available 48-96 hours after online publication and is updated daily on week days.
Initial download of the metrics may take a while.