Fig. 4
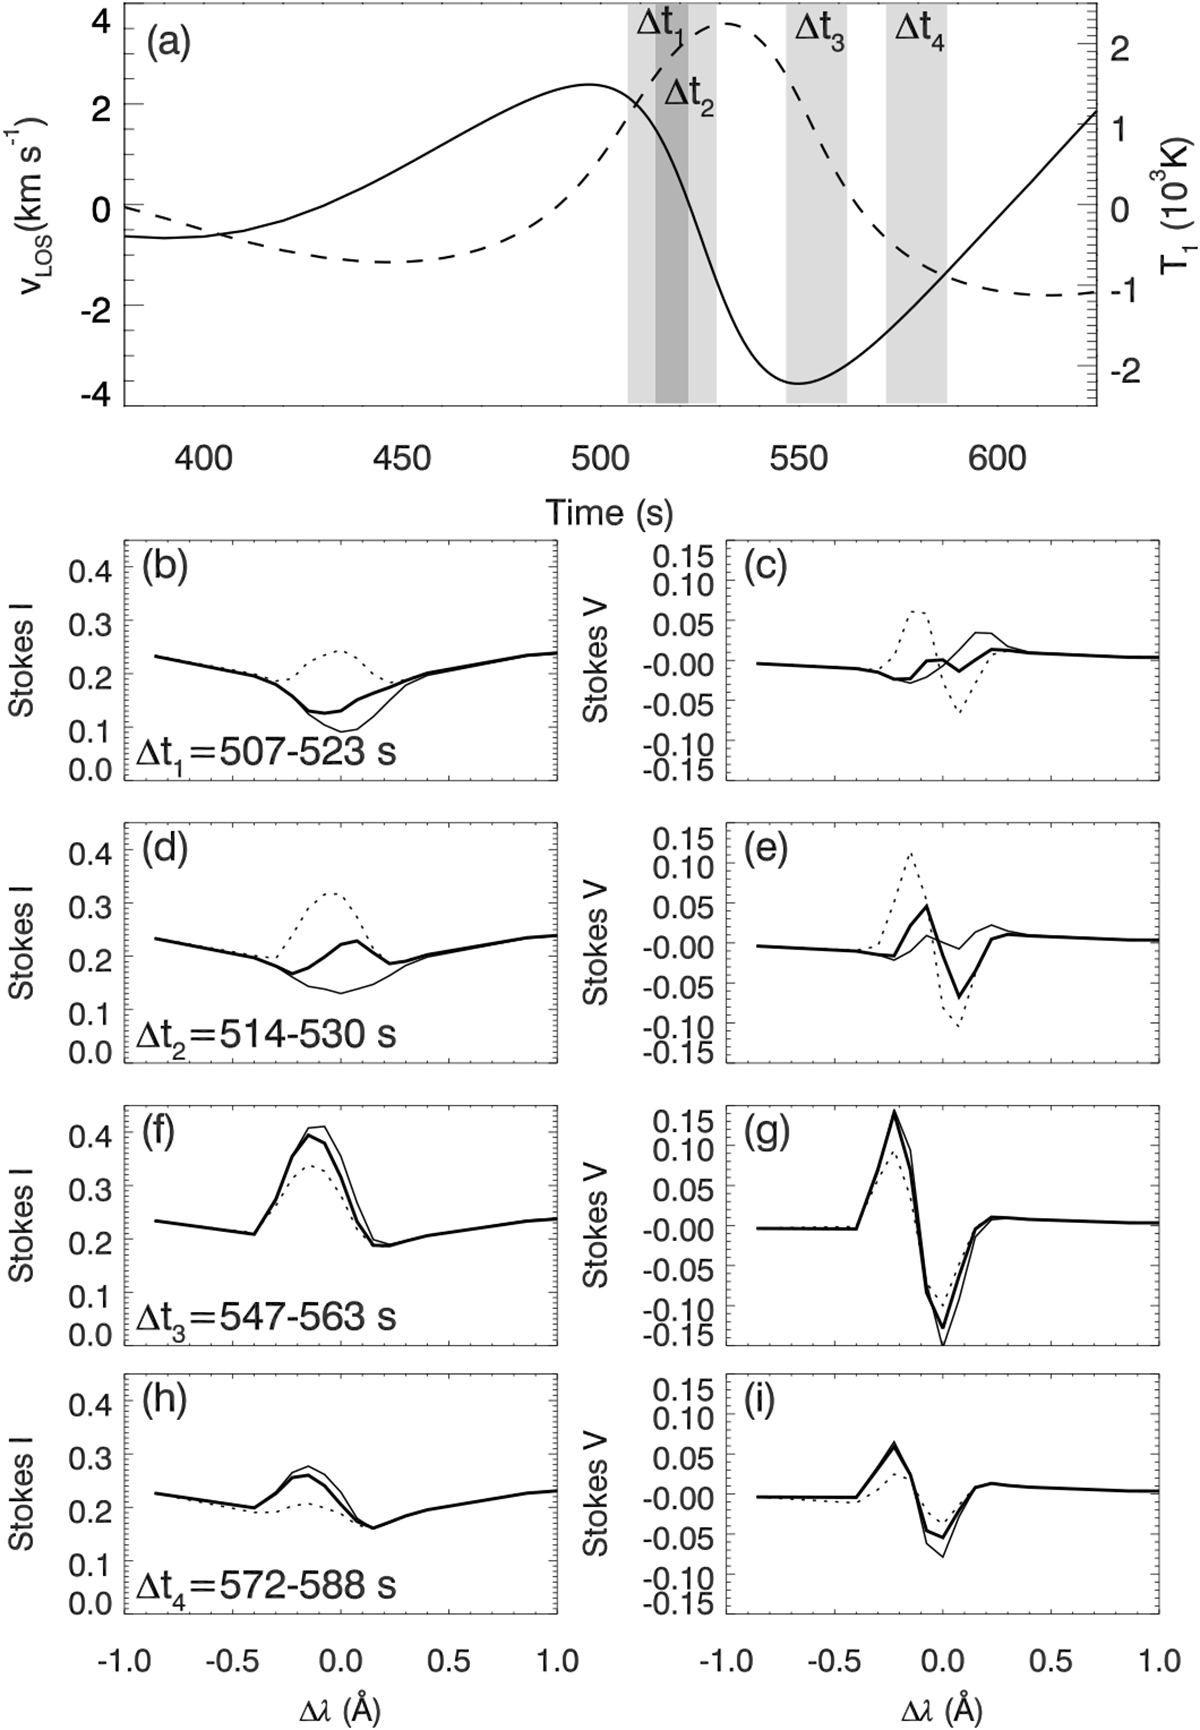
Spectropolarimetric synthesis of the Ca II 8542 Å line imposing the time dependent acquisition of wavelengths in 2D instruments at several time ranges. Top panel: temporal evolution of the vertical velocity (solid line, left axis) and temperature perturbation (dashed line, right axis) at constant geometrical height z = 750 km. Remaining panels: Stokes I (left panels) and Stokes V (right panels) synthesized at the first time step from the range indicated at the top left part of the Stokes I panel (thin solid line), at the last step of the range (thin dotted line), and as measured by 2D instruments (thick solid line). The time range of the acquisition of each profile is indicated by the gray shaded areas in the top panel.
Current usage metrics show cumulative count of Article Views (full-text article views including HTML views, PDF and ePub downloads, according to the available data) and Abstracts Views on Vision4Press platform.
Data correspond to usage on the plateform after 2015. The current usage metrics is available 48-96 hours after online publication and is updated daily on week days.
Initial download of the metrics may take a while.