| Issue |
A&A
Volume 614, June 2018
|
|
|---|---|---|
| Article Number | C2 | |
| Number of page(s) | 3 | |
| Section | Planets and planetary systems | |
| DOI | https://doi.org/10.1051/0004-6361/201732155e | |
| Published online | 06 June 2018 | |
Tensile strength of 67P/Churyumov-Gerasimenko nucleus material from overhangs (Corrigendum)
1
Aix-Marseille Univ., CNRS, Laboratoire d’Astrophysique de Marseille (LAM),
rue Frédéric Juliot-Curie,
13388
Marseille CEDEX 13,
France
e-mail: This email address is being protected from spambots. You need JavaScript enabled to view it.
2
Physikalisches Institut, Sidlerstr. 5, University of Bern,
3012
Bern,
Switzerland
3
Institute of Planetary Research, DLR,
Rutherfordstrasse 2,
12489
Berlin,
Germany
4
Max-Planck-Institut für Sonnensystemforschung,
37077
Göttingen,
Germany
5
Department of Physics and Astronomy, Padova University,
Vicolo dell’Osservatorio 3,
35122
Padova,
Italy
6
Centro de Astrobiologia (INTA-CSIC),
28691
Villanueva de la Canada,
Madrid,
Spain
7
International Space Science Institute,
Hallerstrasse 6,
3012
Bern,
Switzerland
8
Scientific Support Office, European Space Agency,
2201
Noordwijk,
The Netherlands
9
Department of Physics and Astronomy, Uppsala University,
Box 516,
75120
Uppsala,
Sweden
10
PAS Space Research Center,
Bartycka 18A,
00716
Warszawa,
Poland
11
Institute for Geophysics and Extraterrestrial Physics,
TU Braunschweig
38106,
Germany
12
Department of Astronomy, University of Maryland, College Park,
MD
20742-2421,
USA
13
LESIA, Obs. de Paris, CNRS, Univ. Paris 06, Univ. Paris-Diderot,
5 place J. Janssen,
92195
Meudon,
France
14
LATMOS, CNRS/UVSQ/IPSL,
11 boulevard d’Alembert,
78280
Guyancourt,
France
15
Centro di Ateneo di Studi ed Attività Spaziali “Giuseppe Colombo” (CISAS), University of Padova,
via Venezia 15,
35131
Padova,
Italy
16
Department of Industrial Engineering, University of Padova,
35131
Padova,
Italy
17
CNR-IFN UOS Padova LUXOR,
via Trasea 7,
35131
Padova,
Italy
18
UNITN, Università di Trento,
via Mesiano 77,
38100
Trento,
Italy
19
INAF - Osservatorio Astronomico,
via Tiepolo 11,
34143
Trieste,
Italy
20
Instituto de Astrofisica de Andalucía (CSIC), Glorieta de la Astronomía s/n,
18008
Granada,
Spain
21
Institute for Space Science, Nat. Central Univ.,
300 Chung Da Rd.,
32054
Chung-Li,
Taiwan
22
Operations Department, European Space Astronomy Centre ESA,
P.O. Box 78,
28691
Villanueva de la Canada,
Madrid,
Spain
23
Centre for Astrophysics and Planetary Science, School of Physical Sciences (SEPnet), University of Kent,
Canterbury
CT2 7NH,
UK
24
Southwest Research Institute,
1050 Walnut St.,
Boulder,
CO
80302,
USA
25
NASA Ames Research Center, Moffett Field,
CA
94035,
USA
26
MTA CSFK Konkoly Observatory,
Konkoly Thege M. ut 15-17
H1121
Budapest,
Hungary
Received:
22
March
2018
Accepted:
22
March
2018
Key words: comets: general / comets: individual: Churyumov-Gerasimenko / methods: observational / errata, addenda
After publication several small errors in the labelled positions of the features described in this paper were found. Correcting these errors results in changes to Table 1 and Figs. 4, 5, and 6. These changes are: the latitude and longitude, as shown in the table and figures, of features 16 and 17 are swapped; and feature 19 was labelled in an incorrect location and has had its latitude, longitude and position in the figures updated. All other data remains the same.
Locations (in the Cheops frame) and properties of each measured overhang.
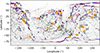 |
Fig. 4 Location of the measured overhangs (orange diamonds). Also shown are high-slope facets on the shape model with the colour scheme: green ≥100°, 100° > blue ≥ 90°, and 90° > red ≥ 85°. |
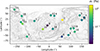 |
Fig. 5 Location of the measured overhangs. The colour scheme shows the tensile strength (unscaled) on a log scale. |
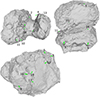 |
Fig. 6 Location of the measured overhangs on the shape model. |
Acknowledgement
We thank Andrew Cooper for spotting the above described errors.
© ESO 2018
 Open Access article, published by EDP Sciences, under the terms of the Creative Commons Attribution License (http://creativecommons.org/licenses/by/4.0;), which permits unrestricted use, distribution, and reproduction in any medium, provided the original work is properly cited.
All Tables
All Figures
|
Fig. 4 Location of the measured overhangs (orange diamonds). Also shown are high-slope facets on the shape model with the colour scheme: green ≥100°, 100° > blue ≥ 90°, and 90° > red ≥ 85°. |
| In the text | |
|
Fig. 5 Location of the measured overhangs. The colour scheme shows the tensile strength (unscaled) on a log scale. |
| In the text | |
|
Fig. 6 Location of the measured overhangs on the shape model. |
| In the text | |
Current usage metrics show cumulative count of Article Views (full-text article views including HTML views, PDF and ePub downloads, according to the available data) and Abstracts Views on Vision4Press platform.
Data correspond to usage on the plateform after 2015. The current usage metrics is available 48-96 hours after online publication and is updated daily on week days.
Initial download of the metrics may take a while.