Fig. 9
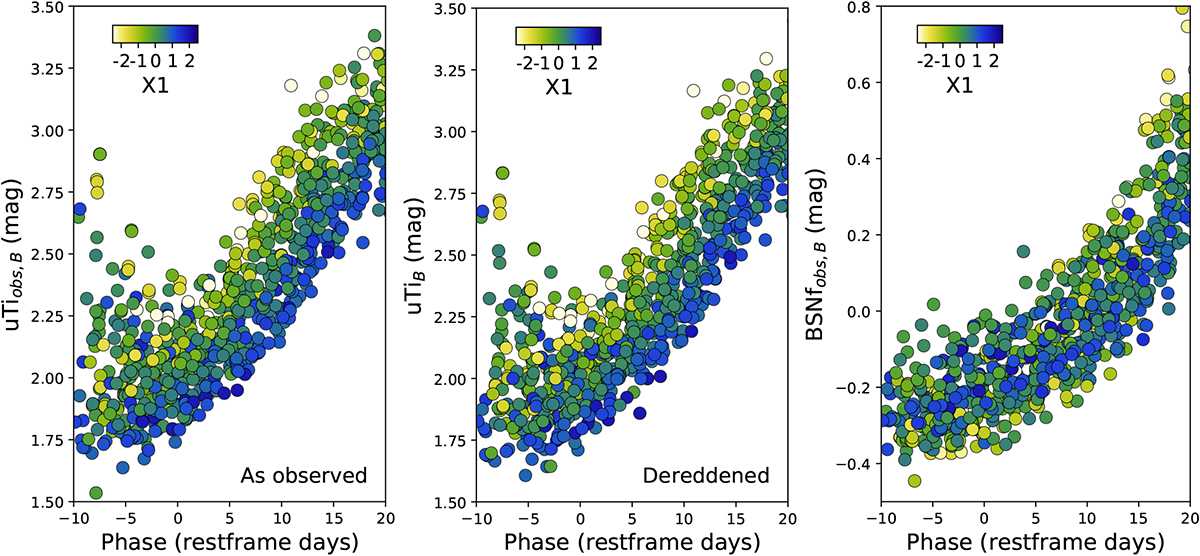
uTi vs. phase with markers colored by SALT2.4x1. The left andmid panels show the uTi color prior to and following F99 dereddening, respectively. The right panel displays the BSNf − VSNf color evolution for reference, calculated from dereddened restframe spectra. Pre-peak observations show a scatter induced by the edge of the Ca H&K λ 3945 feature. uTi colors after peak show a strong stable correlation with light curve width.
Current usage metrics show cumulative count of Article Views (full-text article views including HTML views, PDF and ePub downloads, according to the available data) and Abstracts Views on Vision4Press platform.
Data correspond to usage on the plateform after 2015. The current usage metrics is available 48-96 hours after online publication and is updated daily on week days.
Initial download of the metrics may take a while.