Fig. 7
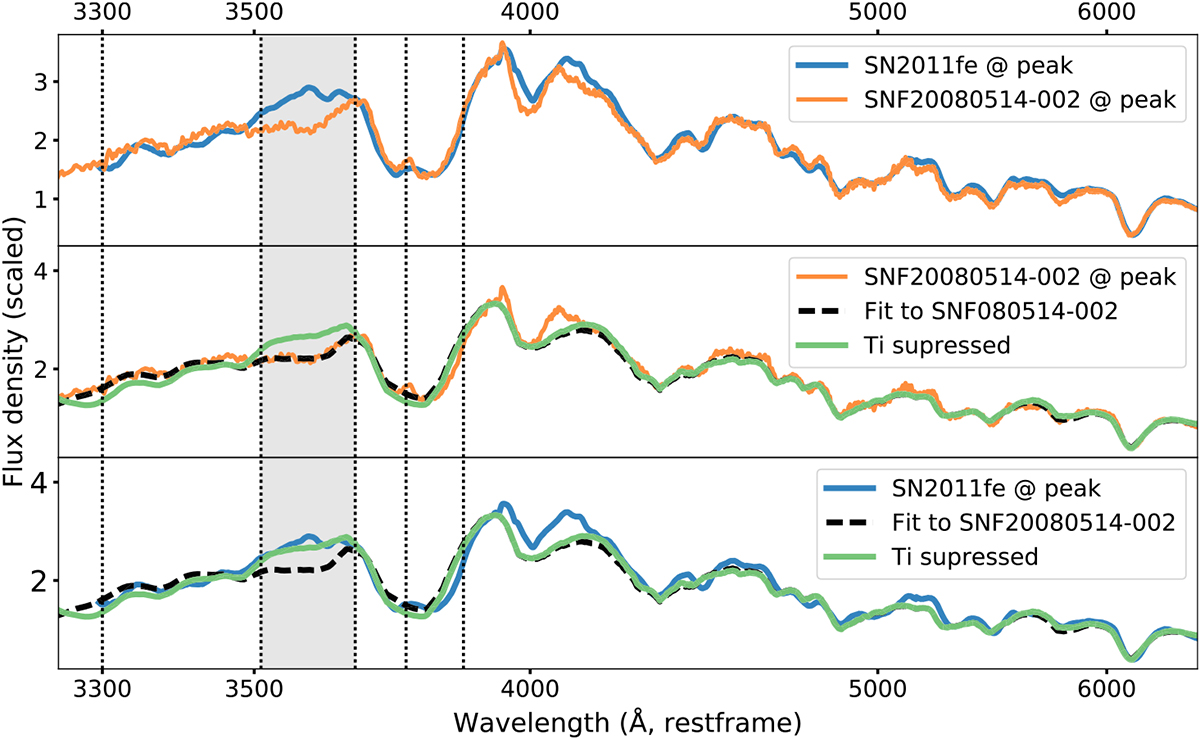
Probing the origin of uTi variation through SYNAPPS model comparisons. The top panel compares SN2011fe and SNF20080514-002 at peak light. The second panel shows SNF20080514-002 (orange line) together with the best SYNAPPS fit of this spectrum (black dashed line). The green line shows the same fit, but with the optical depth (τ) of Ti II decreased by 1 dex, effectively suppressing these ions. The third panel compares the SN2011fe spectrum with the same SNF20080514-002 SYNAPPS fits. The SNF200805014-002 fit with suppressed Ti II optical depth matches the SN2011fe λ(uTi) region well. Vertical dotted lines indicate the U-band spectral index boundaries, with λ(uTi) shaded lightgray.
Current usage metrics show cumulative count of Article Views (full-text article views including HTML views, PDF and ePub downloads, according to the available data) and Abstracts Views on Vision4Press platform.
Data correspond to usage on the plateform after 2015. The current usage metrics is available 48-96 hours after online publication and is updated daily on week days.
Initial download of the metrics may take a while.