Fig. 5
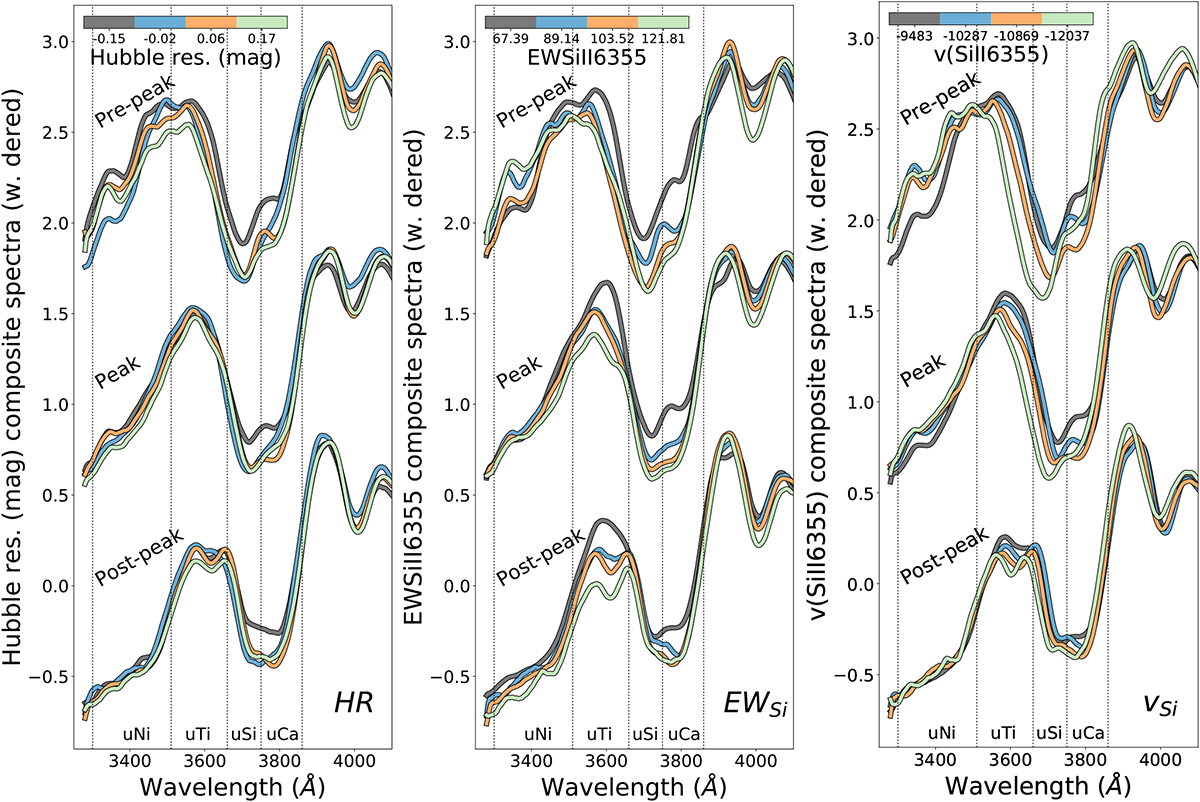
U-band spectroscopic variation spanning the range of common SN properties: Hubble residuals standardized by SALT2.4 light curve parameters, EW(Si II λ6355) and v(Si II λ6355) (left toright). Composite spectra were calculated after dividing the sample into four quartiles based on each property, which was repeated at three representative phase ranges (− 6, 0, 6) for each subset. Subset composites were drawn such that the line color becomes darker as the parameter value decreases. Dotted lines indicate U-band spectral-index subdivision boundaries.
Current usage metrics show cumulative count of Article Views (full-text article views including HTML views, PDF and ePub downloads, according to the available data) and Abstracts Views on Vision4Press platform.
Data correspond to usage on the plateform after 2015. The current usage metrics is available 48-96 hours after online publication and is updated daily on week days.
Initial download of the metrics may take a while.