Fig. 3
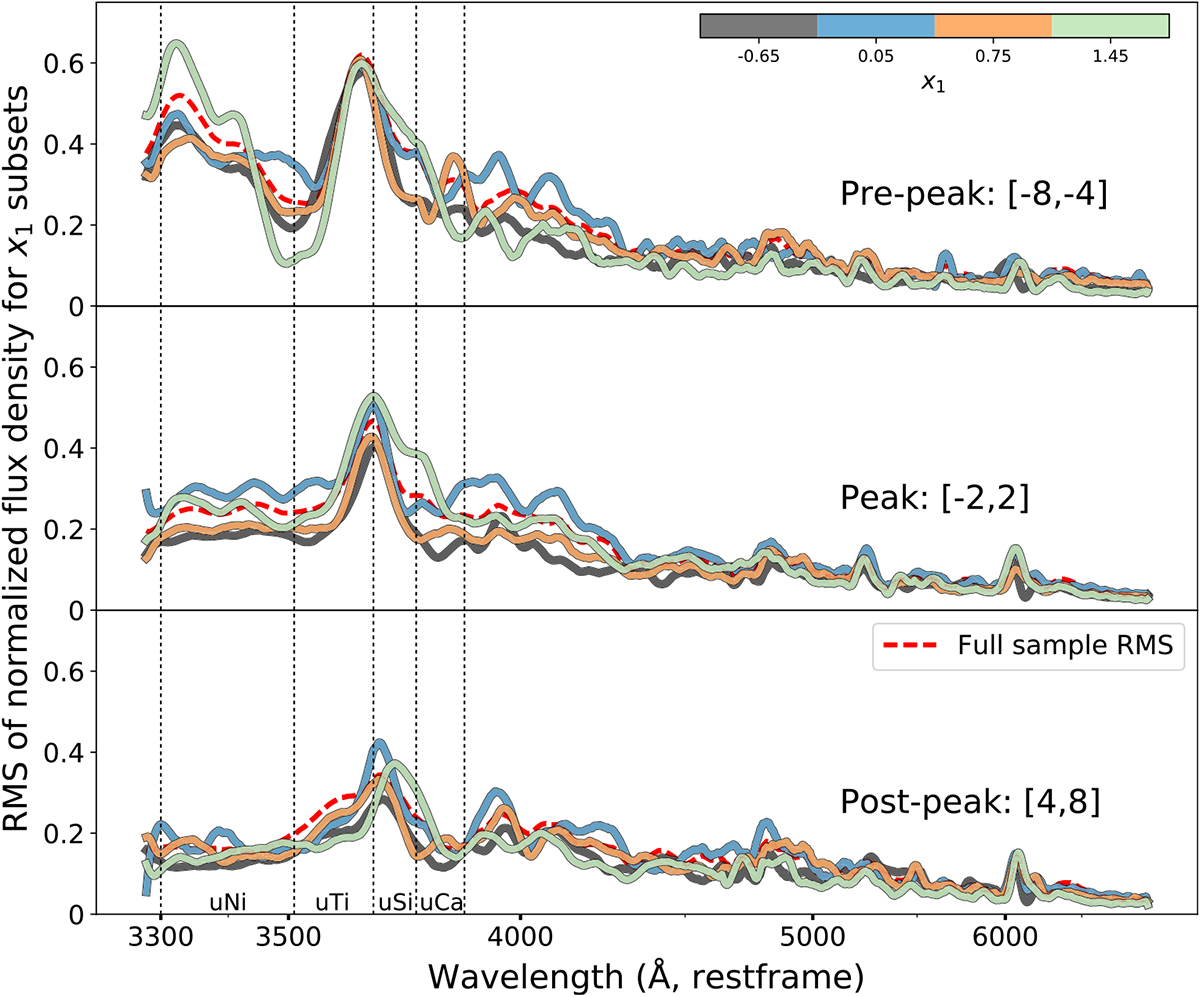
Intrinsic flux RMS (vs. wavelength) for SNe after division into four bins according to increasing light curve width (dark to light lines). Spectra were initially normalized to have median flux of unity over the [3300, 6900] Åwavelength region. Panels from top to bottom show the three sample phase regions (pre-peak, peak and post-peak). Vertical (dotted) lines mark boundaries of the four U-band regions. Thered dashed red line shows the RMS for the full sample.
Current usage metrics show cumulative count of Article Views (full-text article views including HTML views, PDF and ePub downloads, according to the available data) and Abstracts Views on Vision4Press platform.
Data correspond to usage on the plateform after 2015. The current usage metrics is available 48-96 hours after online publication and is updated daily on week days.
Initial download of the metrics may take a while.