Fig. 2
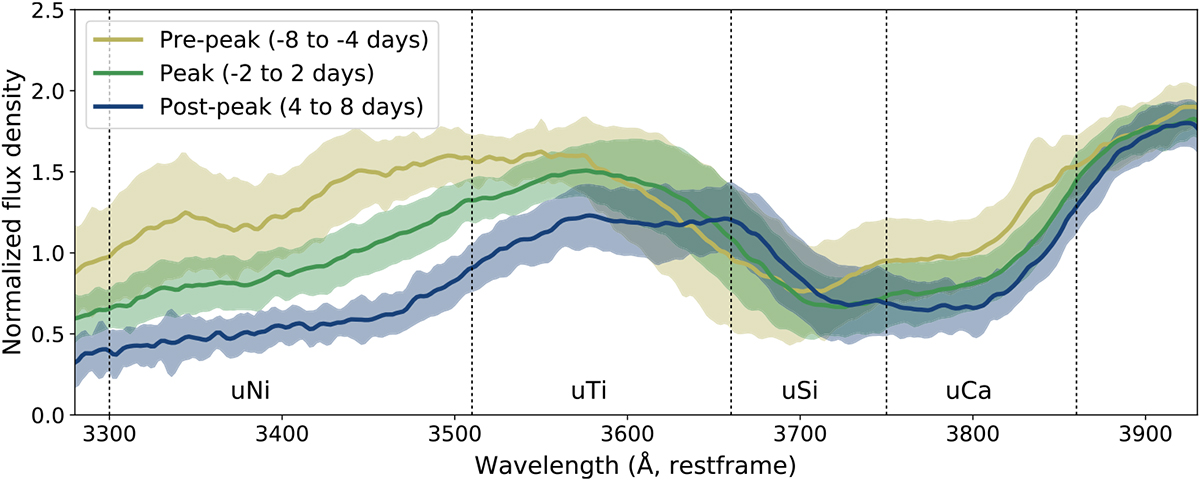
Mean spectra and ± 1 standard deviation in sample at three representative phases. The four wavelength regions considered are separated by dashed lines. The interpretation of these indices will be phase dependent, as, for example, the Ti region at early phases is clearly a part of the Ca H&K λ 3945 + Si II λ3858 feature complex and Cr/Fe dominates uNi at late phases.
Current usage metrics show cumulative count of Article Views (full-text article views including HTML views, PDF and ePub downloads, according to the available data) and Abstracts Views on Vision4Press platform.
Data correspond to usage on the plateform after 2015. The current usage metrics is available 48-96 hours after online publication and is updated daily on week days.
Initial download of the metrics may take a while.