Fig. A.1
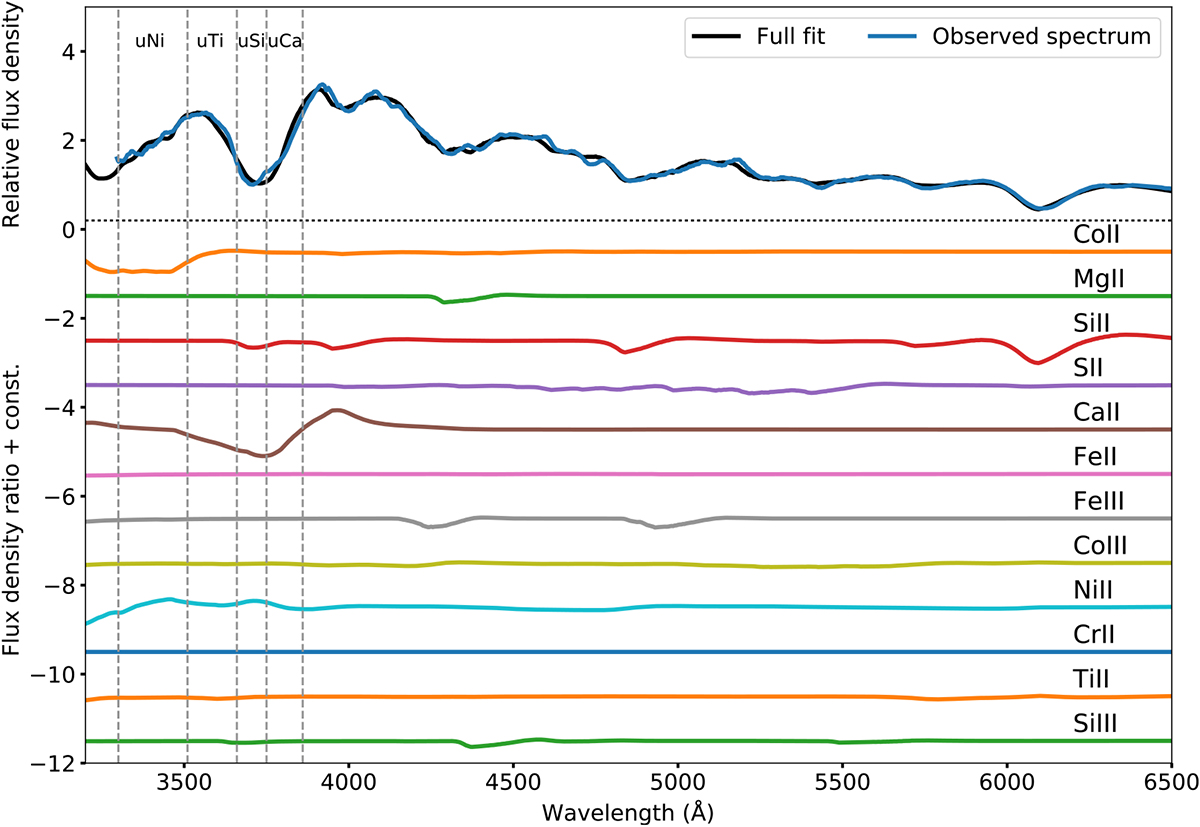
SYNAPPS fit to SN2011fe 10 days prior to peak. The top panel compares the observed spectrum to the full SYNAPPS fit. The lower panels show the contribution of each ion to the final spectra. These are plotted as the ratio between the spectrum with and without each ion activated. Dashed, vertical, gray lines indicate the U-band index regionboundaries, with designations given at the top.
Current usage metrics show cumulative count of Article Views (full-text article views including HTML views, PDF and ePub downloads, according to the available data) and Abstracts Views on Vision4Press platform.
Data correspond to usage on the plateform after 2015. The current usage metrics is available 48-96 hours after online publication and is updated daily on week days.
Initial download of the metrics may take a while.