Fig. 14
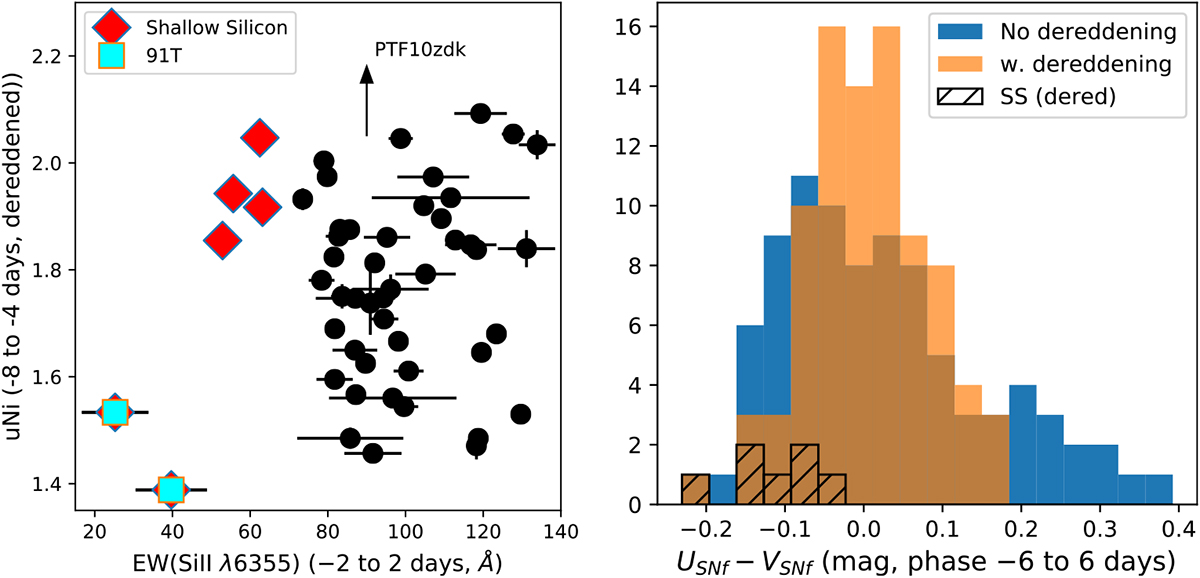
Left: uNi index measurements of SN1991T-like and Shallow Silicon-like SNe Ia compared with EW(Si II λ6355). The SN1991T-like SNe are disconnected from the remaining sample. Right: distribution of USNf − VSNf for spectra within 6 days of light curve peak. The figure shows data with (orange) and without (blue) reddening correction, where the linear evolution with phase was removed for each (returning distributions with zero mean). The Shallow Silicon (SS) subset of the dereddened USNf − VSNf distribution is shown by the cross-hatched histogram.
Current usage metrics show cumulative count of Article Views (full-text article views including HTML views, PDF and ePub downloads, according to the available data) and Abstracts Views on Vision4Press platform.
Data correspond to usage on the plateform after 2015. The current usage metrics is available 48-96 hours after online publication and is updated daily on week days.
Initial download of the metrics may take a while.