Fig. 12
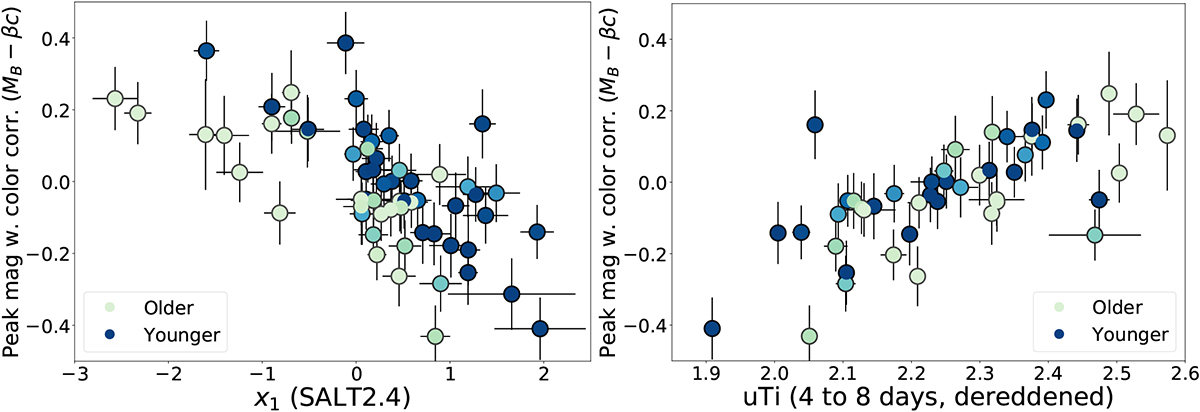
Comparing peak SN magnitude (including color correction) with SALT2.4 x1 (left panel) and uTi (right panel). Lighter shaded points were found in R17 to originate in locally passive regions, and likely from old progenitors, while dark blue points were found in regions dominated by star formation. These are separated in x1 (left), but not in uTi (right).
Current usage metrics show cumulative count of Article Views (full-text article views including HTML views, PDF and ePub downloads, according to the available data) and Abstracts Views on Vision4Press platform.
Data correspond to usage on the plateform after 2015. The current usage metrics is available 48-96 hours after online publication and is updated daily on week days.
Initial download of the metrics may take a while.