Free Access
Fig. 11
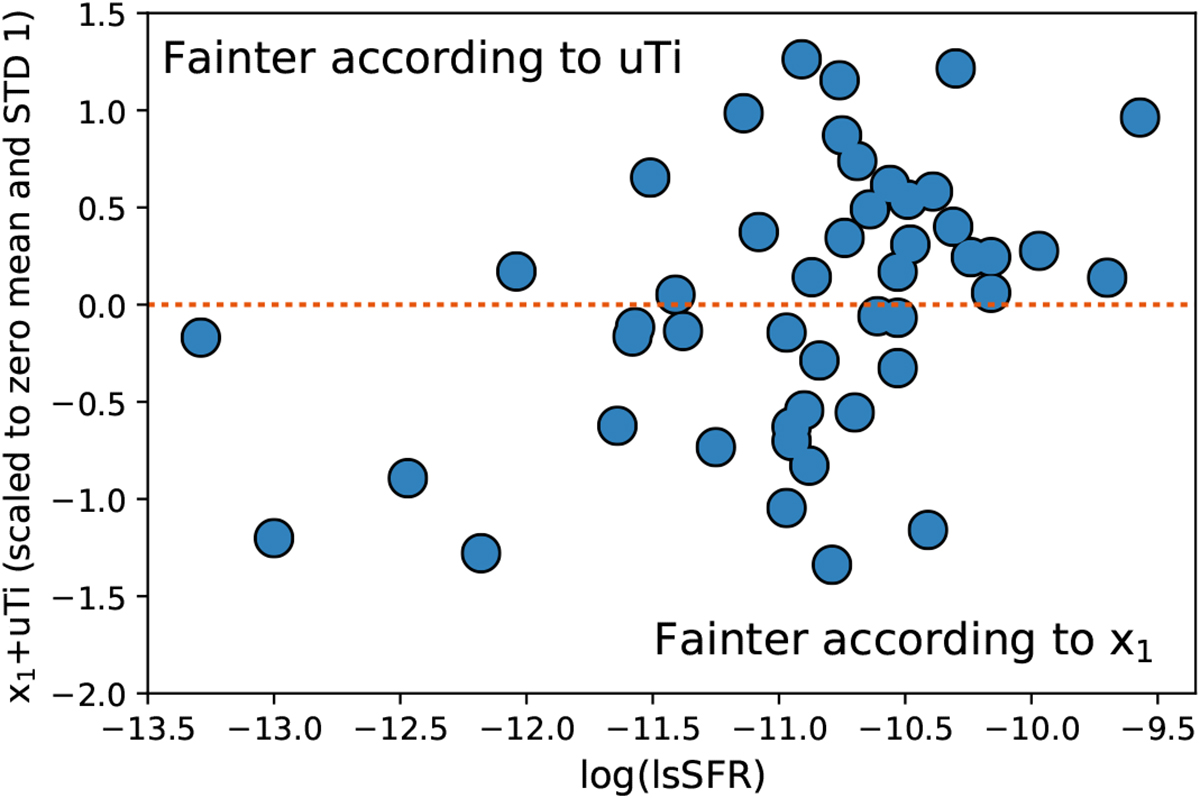
The difference in standardization based on x1 and uTi is examined by comparing their sum (as they are anti-correlated) against local specific star formation (LsSFR). A smaller x1+uTi (y-axis) value corresponds to a SN considered fainter according to x1 relative to what uTi predicts.
Current usage metrics show cumulative count of Article Views (full-text article views including HTML views, PDF and ePub downloads, according to the available data) and Abstracts Views on Vision4Press platform.
Data correspond to usage on the plateform after 2015. The current usage metrics is available 48-96 hours after online publication and is updated daily on week days.
Initial download of the metrics may take a while.