Fig. 10
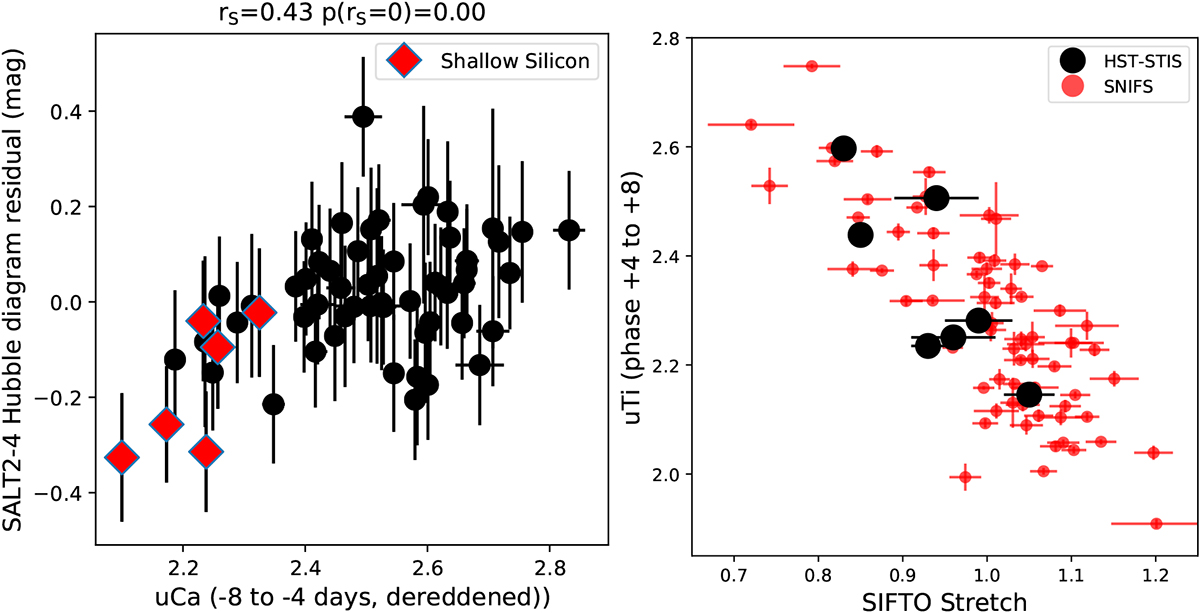
Left:origin of pre-peak uCa correlation with SALT2.4 Hubble residuals. The Spearman correlation coefficient of rs = 0.43 indicates a moderate correlation, with the hypothesis of no correlation at > 99% confidence. Right: comparing the post-peak uTi color integrated from HST-STIS spectra with SIFTO stretch. Spectra were dereddened according to a similar procedure as the SNfactory sample and use light curve data from Maguire et al. (2012). The SNIFS sample presented here is included for comparison, with SALT2.4 x1 values converted to SIFTO stretch using the relation provided by Guy et al. (2010). The trend with uTi agrees betwen these two data sets.
Current usage metrics show cumulative count of Article Views (full-text article views including HTML views, PDF and ePub downloads, according to the available data) and Abstracts Views on Vision4Press platform.
Data correspond to usage on the plateform after 2015. The current usage metrics is available 48-96 hours after online publication and is updated daily on week days.
Initial download of the metrics may take a while.