Fig. 1
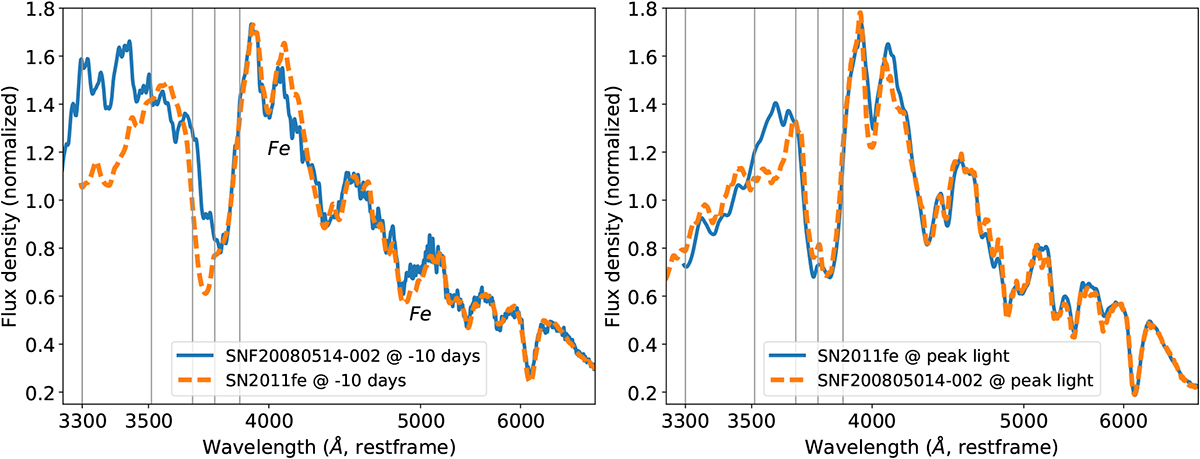
Comparison of the spectra of SN2011fe (SALT2.4x1 = −0.4 and c = −0.06) and SNF200805014-002 (SALT2.4x1 = −1.5 and c = −0.12) at early (left) and peak (right) phases. Small spectroscopic differences are found redwards of 4000 Å(stable Fe marked in left panel). Much larger deviation is found bluewards of this limit. The comparison at early phases differs most strongly around 3400 Åand the high velocity edge of the Ca H&K λ 3945 feature, the comparison at later phases mainly around 3550 Å. These differences led to the subdivision of the U-band into four indices, as described in the text. Vertical lines show the feature limits thus defined.
Current usage metrics show cumulative count of Article Views (full-text article views including HTML views, PDF and ePub downloads, according to the available data) and Abstracts Views on Vision4Press platform.
Data correspond to usage on the plateform after 2015. The current usage metrics is available 48-96 hours after online publication and is updated daily on week days.
Initial download of the metrics may take a while.