Free Access
Fig. 7
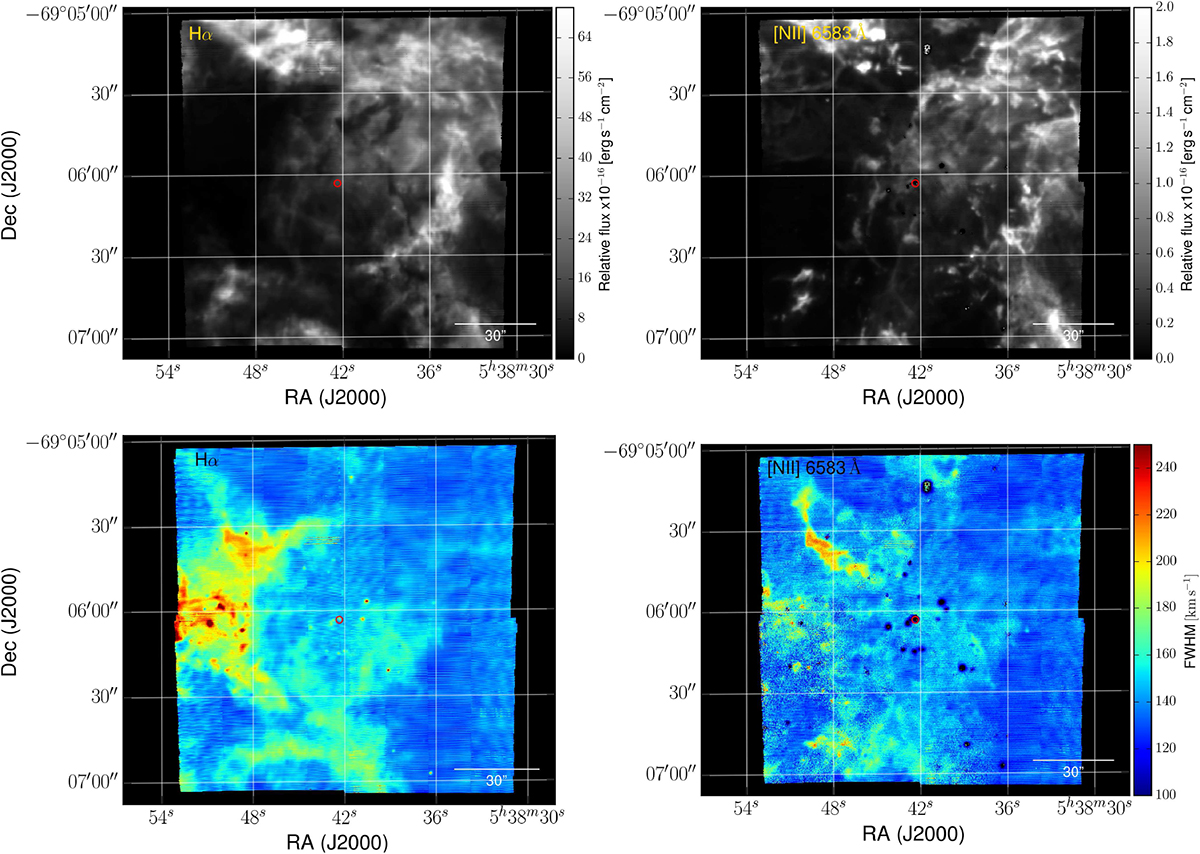
Relative Hα (left) and [N II] λ6583.45 (right) fluxes (upper panels) and full-width at half-maxima (lower panels) extracted from single-component Gaussian fits to both lines in the MUSE datacubes. The red circle indicates the core of R136.
Current usage metrics show cumulative count of Article Views (full-text article views including HTML views, PDF and ePub downloads, according to the available data) and Abstracts Views on Vision4Press platform.
Data correspond to usage on the plateform after 2015. The current usage metrics is available 48-96 hours after online publication and is updated daily on week days.
Initial download of the metrics may take a while.