Fig. 4
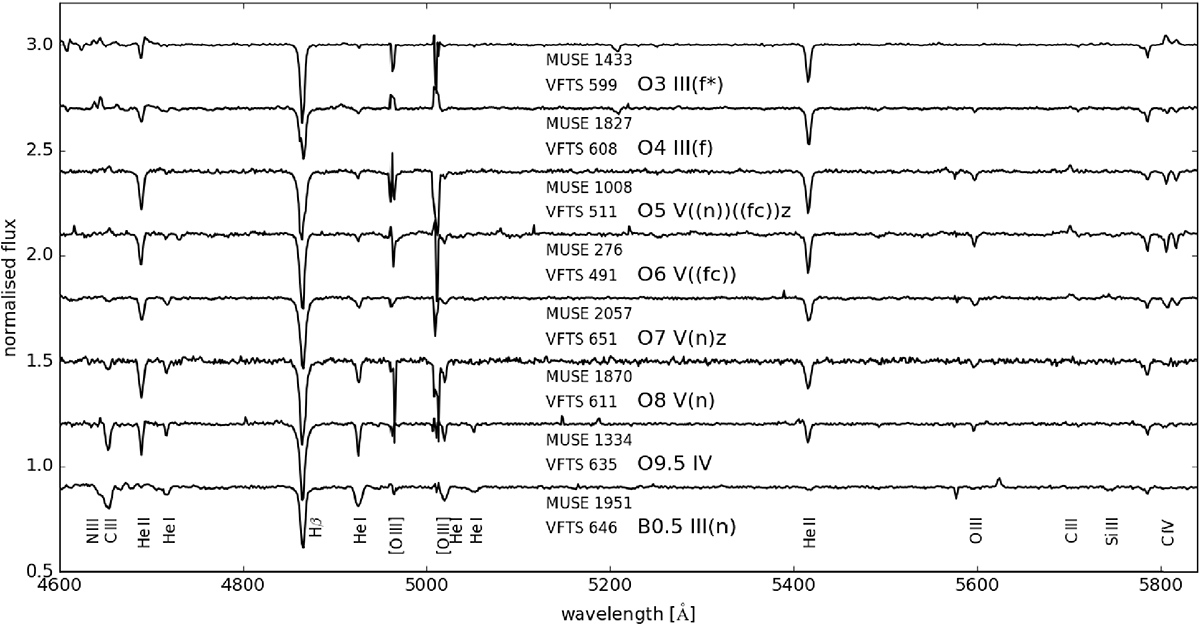
Illustrative O- and early B-type spectra from the MUSE observations, with classifications from Walborn et al. (2014) and Evans et al. (2015). The relevant lines for spectral classification are labelled, as is the location of the nebular [O III] lines (which show residuals from over- and under-subtraction of the local nebulosity).
Current usage metrics show cumulative count of Article Views (full-text article views including HTML views, PDF and ePub downloads, according to the available data) and Abstracts Views on Vision4Press platform.
Data correspond to usage on the plateform after 2015. The current usage metrics is available 48-96 hours after online publication and is updated daily on week days.
Initial download of the metrics may take a while.