Fig. 11
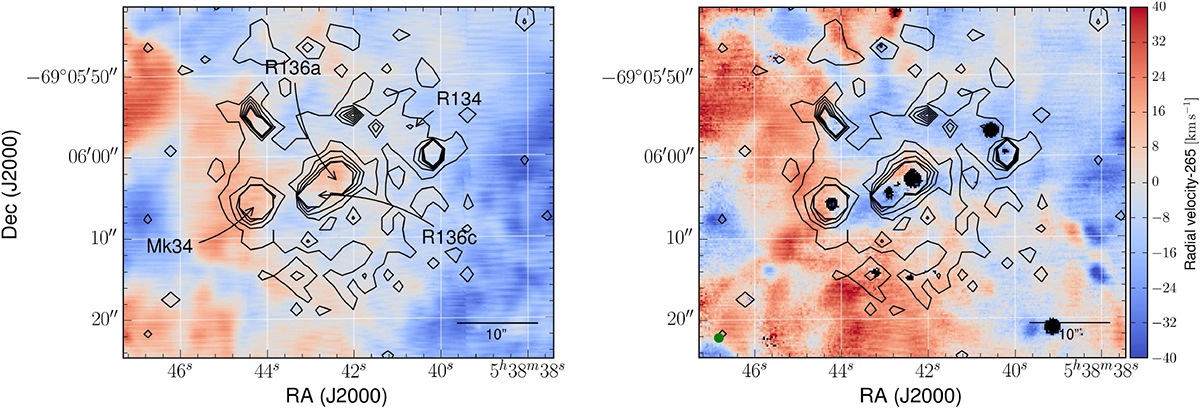
Radial-velocity estimates for the peak Hα and [N II]emission (left- and right-hand panels, respectively) in the vicinity of R136 at the centre of the MUSE mosaic. Contours mark the most prominent X-ray sources from Chandra 1.1–2.3 KeV imaging (Townsley et al. 2006a,b), with the strongest sources labelled in the left-hand panel. Velocities are plotted on the same scale as in Fig. 10. The average PSF of the MUSE data (≈1″) is indicated in the right-hand panel by the green dot in the south-eastern corner.
Current usage metrics show cumulative count of Article Views (full-text article views including HTML views, PDF and ePub downloads, according to the available data) and Abstracts Views on Vision4Press platform.
Data correspond to usage on the plateform after 2015. The current usage metrics is available 48-96 hours after online publication and is updated daily on week days.
Initial download of the metrics may take a while.