Free Access
Fig. 10
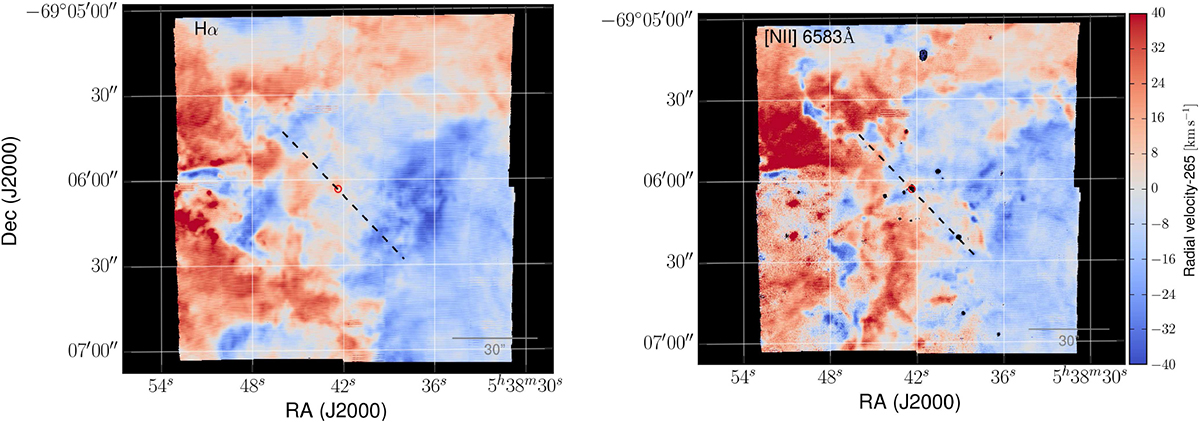
Radial-velocity maps from Gaussian fits to the Hα and [N II] λ6583 emission (left and right panels, respectively). The core of R136 is indicated with the red open circle, and the black dashed line is the proposed rotational axis from Hénault-Brunet et al. (2012b), see Sect. 5.1.
Current usage metrics show cumulative count of Article Views (full-text article views including HTML views, PDF and ePub downloads, according to the available data) and Abstracts Views on Vision4Press platform.
Data correspond to usage on the plateform after 2015. The current usage metrics is available 48-96 hours after online publication and is updated daily on week days.
Initial download of the metrics may take a while.