| Issue |
A&A
Volume 614, June 2018
|
|
|---|---|---|
| Article Number | A61 | |
| Number of page(s) | 7 | |
| Section | The Sun | |
| DOI | https://doi.org/10.1051/0004-6361/201732041 | |
| Published online | 13 June 2018 | |
Strong non-radial propagation of energetic electrons in solar corona
1
Institut für Experimentelle und Angewandte Physik, Universität Kiel,
24118
Kiel,
Germany
e-mail: This email address is being protected from spambots. You need JavaScript enabled to view it.
2
SRG, Universidad de Alcalá, Dpto. de Física y Matemáticas,
28871
Alcalá de Henares,
Spain
3
Institute of Physics/Kanzelhöhe Observatory, University of Graz,
8010
Graz,
Austria
Received:
4
October
2017
Accepted:
20
February
2018
Abstract
Analyzing the sequence of solar energetic electron events measured at both STEREO-A (STA) and STEREO-B (STB) spacecraft during 17–21 July 2014, when their orbital separation was 34°, we found evidence of a strong non-radial electron propagation in the solar corona below the solar wind source surface. The impulsive electron events were associated with recurrent flare and jet (hereafter flare/jet) activity at the border of an isolated coronal hole situated close to the solar equator. We have focused our study on the solar energetic particle (SEP) event on 17 July 2014, during which both spacecraft detected a similar impulsive and anisotropic energetic electron event suggesting optimal connection of both spacecraft to the parent particle source, despite the large angular separation between the parent flare and the nominal magnetic footpoints on the source surface of STA and STB of 68° and 90°, respectively. Combining the remote-sensing extreme ultraviolet (EUV) observations, in-situ plasma, magnetic field, and energetic particle data we investigated and discuss here the origin and the propagation trajectory of energetic electrons in the solar corona. We find that the energetic electrons in the energy range of 55–195 keV together with the associated EUV jet were injected from the flare site toward the spacecraft’s magnetic footpoints and propagate along a strongly non-radial and inclined magnetic field below the source surface. From stereoscopic (EUV) observations we estimated the inclination angle of the jet trajectory and the respective magnetic field of 63° ± 11° relative to the radial direction. We show how the flare accelerated electrons reach very distant longitudes in the heliosphere, when the spacecraft are nominally not connected to the particle source. This example illustrates how ballistic backmapping can occasionally fail to characterize the magnetic connectivity during SEP events. This finding also provides an additional mechanism (one among others), which may explain the origin of widespread SEP events.
Key words: Sun: flares / Sun: particle emission / Sun: magnetic fields
© ESO 2018
1 Introduction and motivation
Multi-spacecraft observations of solar energetic particle (SEP) events using the two STEREO and near-Earth spacecraft have revealed that in some events the intensity distribution of accelerated particles at 1 AU is quite different from that expected (Dresing et al. 2012; Lario et al. 2013). It is much broader (circumsolar; Gómez-Herrero et al. 2015), non-symmetric around the optimal connection, and sometimes irregular with a so-called finger distribution (Klassen et al. 2015, 2016). It had been suggested that these non-symmetric and irregular distributions, among others, may result from non-radial particle injection and propagation in the solar corona. In contrast to these presumptions we believe that we have indeed found particle events showing clear evidence for such a strongly non-radial particle injection and propagation below the solar wind source surface associated with a very long extreme ultraviolet (EUV) jet appearing at the border of an isolated coronal hole (CH). A similar large X-ray jet that occurred inside a CH and originated due to interchange reconnection was described by Shibata et al. (1994). A close association between SEP events, type III radio bursts and long EUV 304 Å jets is reported by Klassen et al. (2012).
We present an investigation of a series of SEP events observed with the Solar Electron and Proton Telescope (SEPT; Müller-Mellin et al. 2008) during the period 17–21 July 2014. The main focus is on the impulsive electron event detected simultaneously at both STEREO-A (STA) and STEREO-B (STB) spacecraft on 17 July, which was associated with a small flare and a giant EUV jet occurring at the border of a CH. At that time the separation between the flare and the estimated nominal magnetic footpoints connecting the source surface to STA and STB was 68° and 90°, respectively, where the measured solar wind speed has been taken into account. Figure 1 shows the orbital position of the two STEREO spacecraft and the Earth on July 17, 2014 with respect to the flaring active region (AR). The majority of the remaining SEP events during this period originated from the same active region but was detected at STA only.
2 Observations
Figure 2 presents an overview of the omnidirectional 55–65 keV electron intensities measured by SEPT at STA (red) and STB (blue) between 17 and 22 July 2014. During this period, STA observed a series of 13, mostly impulsive electron events. Some of them showed a spike-like profile (e.g., Klassen et al. 2012). None of them were detected at near-Earth spacecraft (s/c). Only the first event on 17 July was detected by both STEREO s/c, which showed very similar impulsive time profiles and comparable peak intensities. The remaining SEP events during this period do not show any significant increases at STB. Ten of the 13 events numbered from one to ten in Fig. 2, including the SEP event on 17 July, were associated with recurrent flares and EUV-jet activity in the same small AR located at the border of an isolated equatorial CH with positive polarity. The CH existed for a few solar rotations before and after the studied period.
On 17 July the CH was situated close to the central meridian (CM) when viewed from STA as shown in Fig. 3. The remaining three of the 13 events were associated with activity outside of this CH. The electron event of 17 July was also associated with proton, 4He, and 3He enhancements (Bučík et al. 2018) observed by SIT (the Superthermal Ion Telescope, Mason et al. 2008) and LET (the Low Energy Telescope, Mewaldt et al. 2008) onboard both STEREO s/c and with a velocity dispersed ion event observed by SEPT onboard STA, only (not shown).
The jetting AR, shown in Fig. 3, emerged at the western border of the CH first on 16 July after 1300 UT and disappeared on 21 July after 1700 UT before it rotated onto the hemisphere visible from Earth. Therefore its polarity and magnetic structure (uni- or bipolar) remains unknown. It shows a compact and isolated structure in EUV emission without visible connections (e.g., loops) to neighboring ARs outside the CH. Figure 2 (middle panel), shows the omnidirectional 55–65 keV three-minute averaged electron intensity time profiles of the SEP events on 17 July measured by the two STEREO s/c. The event shows very similar time profiles, peak intensities, and peak intensity spectra (Fig. 4) at both s/c whereas STB detected an onset eight minutes earlier at 0834 UT, in comparison with STA which detected a delayed onset at 0842 UT. The origin of this large delay is unclear and unexpected, especially because the flare is closer to the nominal footpoint of STA than to the footpoint of STB. The second SEP event during this day at 2142 UT (see Fig. 2, top) was detected at STA only. Although the first and the second events were associated with homological recurrent flare activity in the same AR, the second one was not accompanied by a jet activity. Further parameters of the first SEP event and accompanied phenomena are presented in Table 1.
As shown in Fig. 2 (third and fourth panels), STA and STB measured electron anisotropic flux increases at pitch angles (PA) near to 0° and 180°, respectively.These correspond to the particle propagation from the Sun toward the s/c but along opposite magnetic polarities: electrons arrive at STA along outward directed positive polarity and at STB along negative polarity, respectively.
The flare responsible for the SEP event (region number 1 in Fig. 3) occurs on the border of the CH, starting between 080715 and 080945 UT, and reaching its maximum around 0814 UT. It was followed by an EUV jet starting a few minutes later between 081130 (as seen in 284 Å filter) and 081215 UT (171 Å). This timing was determined thanks to very good Extreme UltraViolet Imager (EUVI; Wuelser et al. 2004) image cadence of a few minutes during this time interval. Both phenomena, the flare and the jet, match well the timing of the associated interplanetary (IP) type III radio bursts (Fig. 5) showing a group of type III radio bursts between 0808 and 0816 UT, coincident with the flare and the jet appearance.
To determine the jet direction, extension, speed and its trajectory, as a tracer of the magnetic field configuration between the flare and the s/c footpoints, we used the EUVI 304 Å filter observations. In the other filters the jet is only seen at the very beginning and is not reaching so far distances as in 304 Å. This suggests that the jet contains mainly cool plasma at chromospheric temperatures. Figure 6(top) shows the jet dynamics in a sequence of STA EUVI 304 Å running difference images obtained between 0826 and 0916 UT. Figure 6 (bottom) presents the STB (left) and STA (right) EUV 304 Å seven step running difference images taken between 0816 and 0916 UT. Both figures show a giant jet propagating westward from the flare site situated close to the CH border as seen from both points of view. To our knowledge, it is the longest EUV jet ever to have been observed in association with a SEP event. The jet was approximately one solar radius long and it shows a clear collimated structure with an opening angle of 14° at the beginning and of 22° at its end. As viewed from STA, the jet starts close to the CM and reached the west limb at 0916 UT. At the same time, from STB point of view, it starts at the eastern hemisphere, propagates westward and reached the CM. After 0916 UT, the jet’s very faint prolongation was also seen above the west limb in EUVI images, but without a signature in the COR1 field of view. Figure 7 (left) provides the geometrical reconstruction of the jet trajectory in the ecliptic plane by using the stereoscopic view from both STEREO vantage points based on the jet structure, shape, extension and its visible trajectory from 304 Å observations presented in Fig. 6. For the reconstruction we have assumed a symmetric, three-dimensional conical shape of the jet. The estimated strong non-radial jet trajectory is prolonged from east to west with a maximum length of 830 000 km and an inclination angle of 63° ± 11° relative to the radial direction. The uncertainty of ±11° results fromthe cone opening angle of the collimated jet. Using the average angle of 63° we estimated the actual average jet speed (projected speeds are given in parenthesis, see also Table 1) of 220 (195) km s−1 which varies during its propagation from 430 (380) km s−1 at the beginning (between 0812 and 0833 UT) and of 130 (115) km s−1 to its end between 0856 UT and 0856 UT.
The flare and the jet activity was associated with a weak EIT/EUV -like wave (not shown) propagating in a narrow cone ahead the jet and along the same trajectory. It was seen in the EUVI 171 Å line only. Such a wave in association with a jet is a very rare phenomenon (Zheng et al. 2012) and should be investigated in the future, but is beyond the scope of our study.
To derive the distribution of open coronal magnetic field lines in the vicinity of both s/c footpoints, we apply the potential-field source surface (PFSS) extrapolation (Schrijver & De Rosa 2003) to photospheric field measurements. The topology of open field lines is overlaid on the reconstructed jet trajectory as shown in Fig. 7 (right). The green lines denote positive (outward) polarity and the pink lines negative polarity, respectively. To determine the magnetic field configuration we traced from a square box of 30° width in both latitude and longitude, centered on the STA and STB footpoints at the source surface inward to the photosphere. The PFSS analysis shows that indeed a few of the magnetic field lines originating close to the flare and CH border (with a displacement of 5°− 10° westward from the flare) were connected to the vicinity of the STA footpoint at the source surface. The source surface is fixed at 2.5 solar radii. The PFSS map was produced using the Solarsoft PFSS set of routines. Usually, four PFSS snapshots are available for each day. In this case, we used the snapshot closest to the SEP onset time, which was dated at 06:04 UT on July 17 (two hours prior to the flare). Since at that time the region is located at the solar backside (out of the most reliable window with “fresh” magnetograph data), we have investigated the evolution of the PFSS results between 7 and 25 July (not shown). We find that during this period the magnetic configuration was quite stable. Moreover, most of the time strongly non-radial field lines extending far westward from the AR are visible. Therefore, we conclude that the results shown for July 17 (Fig. 7) provide a reasonable characterization of the magnetic field topology under the PFSS model assumptions and the lack of magnetographic observation at STEREO. At that time the latitudinal separation between both STEREO s/c and Earth was not too big (− 5.9°, − 2.8° and 4.5° heliographic latitude for STA, STB and Earth, respectively).
To be sure that the SEP event was indeed associated with the described flare at the CH border (indicated as AR 1, Fig. 3) and not with any sympathetic activity in other ARs, we carefully inspected the EUV activity outside AR 1 in all available lines. We found, indeed, two additional very weak brightenings originating from a close by but different AR during the suspected time (brightenings 2 and 3, Fig. 3). One of these occurred 10° apart to the west from AR 1 starting nearly simultaneously at 0809 UT, and the other one 12° apart to thesouth starting later around 0820 UT. Their lightcurves (not shown) and peak intensities, derived from EUVI 304 Å images, are significantly (three to five times) lower than of the flare in AR 1. Because the flare in AR 1 was the most prominent and energetic phenomenon and occurred in coincidence with the type III radio bursts starting at 0808 UT (Fig. 5) we are convinced that the flare/jet activity in AR 1 was the most likely particle source of the investigated SEP event. We note that we cannot totally exclude the possibility that the enhancement in AR 2 is a sympathetic activity evolving due to a direct magnetic connection to the flare/jet in AR 1 (e.g., Schrijver et al. 2013). Furthermore, all ten numbered SEP events (1–10, Fig. 2) were associated with flares in the same AR 1 without any EUV activities in ARs 2 and 3. Ultimately, it does not affect our results as to which of these three flares was responsible for the SEP event because all of them were situated close to each other and far away from the estimated s/c footpoints.
Figure 8 shows an overview of in situ plasma and magnetic field data as observed at STA and STB from 16 July to 22 July. The panels display from top to bottom the solar wind proton speed, density, temperature, magnetic field magnitude, and its latitudinal and azimuthal angles in the RTN coordinate system. The vertical line shows the SEP event onset time. During the event, both STA and STB were embedded in slow solar wind streams with Vsw ≤ 415 km s−1, but were situated in sectors of opposite magnetic field polarities: STA in positive (outward) and STB in negative (inward) polarity. According to the STEREO interplanetary coronal mass ejection (ICME) list, provided by L. Jian1 no IP disturbances, such as ICMEs or IP shocks were identified between 17 July and 22 July 2014.
From 13to 17 July no coronal mass ejections (CMEs), which could disturb the nominal magnetic connection to both s/c, with speeds higher than 585 km s−1 and wider than 82° were observed from LASCO/SOHO. The two fastest CMEs with 585 and 519 km s−1 were narrow with widths below 26°. Both expand at position angles near to 270° and were obviously not directed toward STA or STB.
Only a weak corotating interaction region, starting later than the analyzed event, was observed at STA between 18 and 21 July, indicated by a small increase in magnetic field, density, and proton kinetic temperature, still occurring at a solar wind speed below 415 km s−1. The similarity of IP parameters at both s/c, particularly of the solar wind speed, the absence of ICMEs and shocks during the mentioned time interval, together with the absence of large and fast CMEs, suggests relatively quiet IP conditions during this time. This supports the correctness of the backmapped magnetic footpoints of both s/c at the source surface as shown in Figs. 6 and 7. Together, these facts provide evidence that the longitudinal transport must have occurred below the source surface.
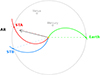 |
Fig. 1 Orbital position of STEREO-A, STEREO-B and Earth in the ecliptic plane on 17 July 2014. The parent active region (AR)and flare location is indicated with an arrow. |
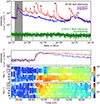 |
Fig. 2 Overview of electron time profiles measured at STEREO-A (red), STEREO-B (blue) and SOHO (green) during 17–21 July 2014. Top: sequence of electron events (numbers: 1–10) which originated from the same active region. Only the first event on 17 July was detected at both STEREO spacecraft. Bottom: enlarged three-minute averaged, omnidirectional time profilesand intensity pitch-angle (PA) distributions of the first event (shaded interval on the top). Both spacecraft detected anisotropic PA distributions, similar time profiles and peak intensities with an earlier onset at STEREO-B. |
SEP event characteristics.
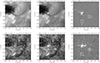 |
Fig. 3 STEREO-A/EUVI images (top: 284 Å, bottom: 304 Å) showing the coronal hole and the flaring regions during the SEP event on 17 July 2014. The left panels show a pre-event image, the middle panels show snapshots close to the event peak, and the right panels show the ratio between the two images to highlight the differences. The boxes indicate regions in which changes are observed. Region [1] shows the strongest flare brightening and produced a very long jet (see Fig. 6). |
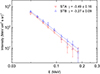 |
Fig. 4 Omnidirectional electron peak intensity spectra in the energy range 45–195 keV. Pre-event background spectra are subtracted. The red and blue dashed lines represent the power-law fits to the STEREO-A and STEREO-B data, respectively, showing very similar slopes. |
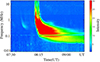 |
Fig. 5 STEREO-A/SWAVES dynamic radio spectrum of type III bursts during the flare/jet showing an electron injection between 0808 and 0816 UT. |
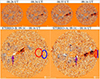 |
Fig. 6 Jet dynamics in EUVI 304 Å running difference images. Top: sequence of STEREO-A images showing the direction and trajectory of the jet between 0826 and 0916 UT. Bottom: STEREO-B (left) and STEREO-A (right) seven step difference images obtained between 0816 and 0916 UT showing the giant jet propagating from the central meridian to the west limb as viewed from STEREO-A. The arrows indicate the flare location and the ellipses show the nominal magnetic footpoints ± 10° of STEREO-A (red) and STEREO-B (blue). |
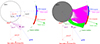 |
Fig. 7 Jet trajectory reconstruction in the ecliptic plane using the stereoscopic observations from both STEREO points of view. Left: jet reconstruction from EUVI 304 Å images taken between 0812 and 0916 UT. The reconstruction yields a strongly non-radial jet trajectory from the flare site toward the magnetic footpoints of both s/c with an estimated inclination angle of β = 63 ± 11° relative to the radial direction. δ = 34° and α = 22° are the longitudinal and footpoint separations between STEREO-A and STEREO-B, respectively. ϕA = 71° and ϕB = 58° are the angles between the s/c longitudes and their footpoints for STEREO-A and STEREO-B, respectively. The magnetic fields correspond to positive (green, outward arrow) and negative polarities (pink, inward arrow). Right: jet trajectory overplotted by PFSS open magnetic field lines. |
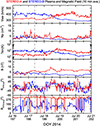 |
Fig. 8 Solar wind and magnetic field measurements from 16 to 21 July 2014 (red: STEREO-A, blue: STEREO-B). From top to bottom: solar wind proton speed, proton density, proton temperature, magnetic field magnitude, magnetic field latitudinal, and longitudinal angles. The dashed line shows the SEP onset. |
3 Discussion
On 17 July 2014, a near-relativistic electron event was observed at both STA and STB spacecraft which were separated on their orbits by 32°, whereas their magnetic footpoints were separated by 22°. STA detected a delayed SEP onset with respect to STB by eight minutes. Despite these facts, however, the in-situ observations together with remote-sensing EUV observations show clear evidence that both s/c detected the same SEP event that originated from a small flare and jet activity in an AR situated at the western border of an isolated CH. The AR and the parent flare itself were far separated from the estimated magnetic footpoints of STA and STB at the source surface by 68° and 90°, respectively.
The following observations support the common origin of SEPs detected at the two spacecraft:
- 1.
The examination of multi-point EUV observations revealed an unambiguous identification of a particle source which was strongly separated from the s/c nominal footpoints.
- 2.
The observed type III bursts, indicative for energetic electron injections into the IP medium, occur during the flare and the jet appearance as shown in Figs. 3, 5 and 6.
- 3.
Very similar electron time profiles, comparable peak intensities and energy spectra with γ of –3.4 and –3.3 at STA and STB, respectively, suggest a common source.
We should note that the backmapping of the magnetic field (and nominal Parker spiral) is done up to the source surface only using the solar wind speed, measured during the onset of the SEP event. However, the uncertainty of the estimated s/c footpoint positions could be as large ±10° (e.g., Ippolito et al. 2005) or even larger, if the magnetic field configuration below the source surface is taken into account (Klein et al. 2008; Lario et al. 2016; Peleikis et al. 2017).
On the one hand, the exact magnetic field configuration below the source surface during the event is unknown, due to the lack of magnetographic observations at STEREO and at the solar backside. This is an additional uncertainty of the estimated magnetic connections between the flare and the s/c. On the other hand, the magnetic connections from the STA footpoint to the region close to the SEP responsible flare (shown in Fig. 7), and our PFSS study for the period between 7 and 25 July, suggest the existence of long-term, non-radial magnetic field lines extending far westward from the surroundings of the parent AR. The jet trajectory itself traces this magnetic field, showing evidently its extended and inclined configuration.
The majority of the remaining SEP events, shown in Fig. 2 (numbers 2–10), were also associated with recurrent small flares and jets originating from the same AR at the CH’s border. It is not clear why these events were detected at STA, only, and not at STB. Obviously, the magnetic connection between the flare and STB was interrupted sometime after the first SEP event. It was not recovered during the following days although the separation between the flare and the STB footpoint became smaller.
Previous jet imaging observations (e.g., Raouafi et al. 2016; Innes et al. 2016, as reviews) and modeling (Yokoyama & Shibata 1995; Pariat et al. 2015) have shown that the jet material should be ejected and transported along open field lines (Shimojo & Shibata 2000). Furthermore, the associated type III bursts should propagate along the same trajectory as the jet, at least below the source surface (Aurass et al. 1994; Klassen et al. 2012; Chen et al. 2013). Additionally the observation of near-relativistic electrons in-situ at 1 AU requires that the large-scale coronal magnetic field should be also open to interplanetary space (e.g., Nitta et al. 2008).
Taken into account all these results and presuming that the flare/jet activity is the unambiguous parent source of the SEP event, detected at the two STEREO s/c, we suggest that the near-relativistic electrons accelerated during the flare propagate toward the footpoints of both s/c along the same trajectory as the EUV jet. We estimate, based on simultaneous STA and STB stereoscopic observations, the inclination angle of the EUV jet as 63° ± 11° (Fig. 7). This means, that the high-energy electrons together with the type III emitting electrons propagate through the corona along the same strong non-radial path like the jet with a similar inclination.
The fact that both STEREO s/c detected almost identical SEP events implies, on the one hand, a connection to the same source, that is, to a small point-like flare in our case. On the other hand, the injection region at the source surface must be larger and not point-like with an extension of at least 22°. This corresponds to the nominal footpoint separation of both s/c at the source surface and the jet width (see Table 1).
The observed SEP onset timing is not expected and not yet understood, especially with respect to the relatively large delay at STA versus STB by eight minutes. The earlier onset was observed at STB although the footpoint separation of 22° between both s/c was relatively small, with the STB footpoint being even further away from the flare than the STA footpoint. Such a situation, in which the further separated s/c detected the SEP onset first is rare but not unique and was first described in Klassen et al. (2015, 2016). Nevertheless, an explanation remains puzzling and we can only guess that the effective lengths of the propagation paths from the Sun to both s/c might be very different in comparison to the estimated length of the nominal Parker spiral (Klassen et al. 2016). This could be either caused by strong magnetic field meandering in the interplanetary medium (Laitinen et al. 2016) and/or by strongly differing IP propagation conditions between the source surface and the s/c position (Ragot 2006), although both s/c were situated close to each other on their orbits.
An additional fact that seems to disagree with our expectation is that STB and STA were situated in different magnetic field sectors. The CH and STA were inside positive and STB was in negative polarity, respectively, which is opposite to the CH field. We note that the CH polarity, where the flaring AR and the jet appeared, was inferred from measurements taken ten days after the event, when the CH rotated onto the hemisphere visible from Earth2.
Some models and observations explaining the origin of jets due to interchange reconnection suggest that the jet material and consequently the SEPs should escape the acceleration site along open magnetic fields (e.g., Wyper et al. 2017). In our case it should be along the CH’s open field lines with positive polarity. In contrast to this model, the SEP onset was detected first at STB situated inside opposite polarity fields, which contradicts the prediction of the interchange model.
Our observations rather confirm the model of Higginson et al. (2017) suggesting a broad fan-arc-shaped distribution of open filed lines in the heliosphere originating presumably by field-line openings or by interchange reconnection near to the CH border. Furthermore, this model predicts a magnetic connection from a local region close to a CH to angular remote locations in the heliosphere as in the presented case.
4 Conclusion
The presented observations provide evidence of a strong non-radial propagation of near-relativistic electrons in the solar corona below the source surface, during the SEP event on 17 July 2014. The event was associated with a small flare occurring at the border of an isolated equatorial CH and a very long EUV jet which propagated from the flare site toward the magnetic footpoints of both s/c, along a strongly inclined trajectory (63°) relative to the local radial direction.
The energetic electrons propagate along the same path as the observed EUV jet and were detected at both STEREO s/c, despite the large angular separation of 68° and 90° between the flare and the estimated nominal magnetic footpoints of STA and STB, respectively. Despite this large separation, one of the widest reported so far, both spacecraft detected a similar impulsive and anisotropic electron event, suggesting an optimal connection to the parent particle source.
This illustrates very well that the accuracy of ballistic backmapping is sometimes not sufficient to characterize the magnetic connectivity of the spacecraft to the Sun during SEP events. The main deviation from the nominal magnetic connectivity occurs evidently below the source surface. We have shown how the electrons, accelerated during a small flare and jet activity, propagate along strongly non-radial magnetic fields below the source surface and reach very distant longitudes in the heliosphere, when the flare was not nominally connected to the spacecraft.
Acknowledgements
We thank the STEREO/SWAVES/SECCHI/PLASTIC/MAG and GONG teams for providing the data and the FESTIVAL team who developed the browser for solar imaging data. R. Gómez-Herrero acknowledges the financial support of the Spanish Ministerio de Economía y Competitividad under project ESP2015-68266-R and the University of Alcalá under project CCG2015/EXP-055. A.V. acknowledges the Austrian Science Fund (FWF): P27292-N20. The STEREO/SEPT and SOHO/EPHIN projects are supported under grant 50 OC 1702 by the German Bundesministerium für Wirtschaft through the Deutsches Zentrum für Luft- und Raumfahrt (DLR).
References
- Aurass, H., Klein, K.-L., & Martens, P. C. H. 1994, Sol. Phys., 155, 203 [NASA ADS] [CrossRef] [Google Scholar]
- Bučík, R., Innes, D. E., Mason, G. M., et al. 2018, ApJ, 852, 76 [NASA ADS] [CrossRef] [Google Scholar]
- Chen, B., Bastian, T. S., White, S. M., et al. 2013, ApJ, 763, L21 [NASA ADS] [CrossRef] [Google Scholar]
- Dresing, N., Gómez-Herrero, R., Klassen, A., et al. 2012, Sol. Phys., 281, 281 [NASA ADS] [Google Scholar]
- Gómez-Herrero, R., Dresing, N., Klassen, A., et al. 2015, ApJ, 799, 55 [NASA ADS] [CrossRef] [Google Scholar]
- Higginson, A. K., Antiochos, S. K., DeVore, C. R., Wyper, P. F., & Zurbuchen, T. H. 2017, ApJ, 840, L10 [NASA ADS] [CrossRef] [Google Scholar]
- Innes, D. E., Bučík, R, Guo, L.-J., & Nitta, N. 2016, Astron. Nachr., 337, 1024 [NASA ADS] [CrossRef] [Google Scholar]
- Ippolito, A., Pommois, P., Zimbardo, G., & Veltri, P. 2005, A&A, 438, 705 [NASA ADS] [CrossRef] [EDP Sciences] [Google Scholar]
- Klassen, A., Gómez-Herrero, R., Heber, B., et al. 2012, A&A, 542, A28 [NASA ADS] [CrossRef] [EDP Sciences] [Google Scholar]
- Klassen, A., Dresing, N., Gómez-Herrero, R., & Heber, B. 2015, A&A, 580, A115 [NASA ADS] [CrossRef] [EDP Sciences] [Google Scholar]
- Klassen, A., Dresing, N., Gómez-Herrero, R., Heber, B., & Müller-Mellin, R. 2016, A&A, 593, A31 [NASA ADS] [CrossRef] [EDP Sciences] [Google Scholar]
- Klein, K.-L., Krucker, S., Lointier, G., & Kerdraon, A. 2008, A&A, 486, 589 [NASA ADS] [CrossRef] [EDP Sciences] [Google Scholar]
- Laitinen, T., Kopp, A., Effenberger, F., Dalla, S., & Marsh, M. S. 2016, A&A, 591, A18 [NASA ADS] [CrossRef] [EDP Sciences] [Google Scholar]
- Lario, D., Aran, A., Gómez-Herrero, R., et al. 2013, ApJ, 767, 41 [NASA ADS] [CrossRef] [Google Scholar]
- Lario, D., Kwon, R.-Y., Vourlidas, A., et al. 2016, ApJ, 819, 72 [NASA ADS] [CrossRef] [Google Scholar]
- Mason, G. M., Korth, A., Walpole, P. H., et al. 2008, Space Sci. Rev., 136, 257 [NASA ADS] [CrossRef] [Google Scholar]
- Mewaldt, R. A., Cohen, C. M. S., Cook, W. R., et al. 2008, Space Sci. Rev., 136, 285 [NASA ADS] [CrossRef] [Google Scholar]
- Müller-Mellin, R., Böttcher, S., Falenski, J., et al. 2008, Space Sci. Rev., 136, 363 [NASA ADS] [CrossRef] [Google Scholar]
- Nitta, N. V., Mason, G. M., Wiedenbeck, M. E., et al. 2008, ApJ, 675, L125 [NASA ADS] [CrossRef] [Google Scholar]
- Pariat, E., Dalmasse, K., DeVore, C. R., Antiochos, S. K., & Karpen, J. T. 2015, A&A, 573, A130 [NASA ADS] [CrossRef] [EDP Sciences] [Google Scholar]
- Peleikis, T., Kruse, M., Berger, L., & Wimmer-Schweingruber, R. 2017, A&A, 602, A24 [NASA ADS] [CrossRef] [EDP Sciences] [Google Scholar]
- Ragot, B. R. 2006, ApJ, 653, 1493 [NASA ADS] [CrossRef] [Google Scholar]
- Raouafi, N. E., Patsourakos, S., Pariat, E., et al. 2016, Space Sci. Rev., 201, 1 [NASA ADS] [CrossRef] [Google Scholar]
- Schrijver, C. J., & De Rosa, M. L. 2003, Sol. Phys., 212, 165 [Google Scholar]
- Schrijver, C. J., Title, A. M., Yeates, A. R., & DeRosa, M. L. 2013, ApJ, 773, 93 [NASA ADS] [CrossRef] [Google Scholar]
- Shibata, K., Nitta, N., Strong, K. T., et al. 1994, ApJ, 431, L51 [NASA ADS] [CrossRef] [Google Scholar]
- Shimojo, M., & Shibata, K. 2000, ApJ, 542, 1100 [NASA ADS] [CrossRef] [Google Scholar]
- Wuelser, J.-P., Lemen, J. R., Tarbell, T. D., et al. 2004, in Telescopes and Instrumentation for Solar Astrophysics, eds. S. Fineschi, & M. A. Gummin, Proc. SPIE, 5171, 111 [NASA ADS] [CrossRef] [Google Scholar]
- Wyper, P. F., Antiochos, S. K., & DeVore, C. R. 2017, Nature, 544, 452 [NASA ADS] [CrossRef] [Google Scholar]
- Yokoyama, T. & Shibata, K. 1995, Nature, 375, 42 [NASA ADS] [CrossRef] [Google Scholar]
- Zheng, R., Jiang, Y., Yang, J., et al. 2012, A&A, 541, A49 [NASA ADS] [CrossRef] [EDP Sciences] [Google Scholar]
e.g., http://www.solen.info/solar/old_reports/2014/ july/20140729.html.
All Tables
All Figures
|
Fig. 1 Orbital position of STEREO-A, STEREO-B and Earth in the ecliptic plane on 17 July 2014. The parent active region (AR)and flare location is indicated with an arrow. |
| In the text | |
|
Fig. 2 Overview of electron time profiles measured at STEREO-A (red), STEREO-B (blue) and SOHO (green) during 17–21 July 2014. Top: sequence of electron events (numbers: 1–10) which originated from the same active region. Only the first event on 17 July was detected at both STEREO spacecraft. Bottom: enlarged three-minute averaged, omnidirectional time profilesand intensity pitch-angle (PA) distributions of the first event (shaded interval on the top). Both spacecraft detected anisotropic PA distributions, similar time profiles and peak intensities with an earlier onset at STEREO-B. |
| In the text | |
|
Fig. 3 STEREO-A/EUVI images (top: 284 Å, bottom: 304 Å) showing the coronal hole and the flaring regions during the SEP event on 17 July 2014. The left panels show a pre-event image, the middle panels show snapshots close to the event peak, and the right panels show the ratio between the two images to highlight the differences. The boxes indicate regions in which changes are observed. Region [1] shows the strongest flare brightening and produced a very long jet (see Fig. 6). |
| In the text | |
|
Fig. 4 Omnidirectional electron peak intensity spectra in the energy range 45–195 keV. Pre-event background spectra are subtracted. The red and blue dashed lines represent the power-law fits to the STEREO-A and STEREO-B data, respectively, showing very similar slopes. |
| In the text | |
|
Fig. 5 STEREO-A/SWAVES dynamic radio spectrum of type III bursts during the flare/jet showing an electron injection between 0808 and 0816 UT. |
| In the text | |
|
Fig. 6 Jet dynamics in EUVI 304 Å running difference images. Top: sequence of STEREO-A images showing the direction and trajectory of the jet between 0826 and 0916 UT. Bottom: STEREO-B (left) and STEREO-A (right) seven step difference images obtained between 0816 and 0916 UT showing the giant jet propagating from the central meridian to the west limb as viewed from STEREO-A. The arrows indicate the flare location and the ellipses show the nominal magnetic footpoints ± 10° of STEREO-A (red) and STEREO-B (blue). |
| In the text | |
|
Fig. 7 Jet trajectory reconstruction in the ecliptic plane using the stereoscopic observations from both STEREO points of view. Left: jet reconstruction from EUVI 304 Å images taken between 0812 and 0916 UT. The reconstruction yields a strongly non-radial jet trajectory from the flare site toward the magnetic footpoints of both s/c with an estimated inclination angle of β = 63 ± 11° relative to the radial direction. δ = 34° and α = 22° are the longitudinal and footpoint separations between STEREO-A and STEREO-B, respectively. ϕA = 71° and ϕB = 58° are the angles between the s/c longitudes and their footpoints for STEREO-A and STEREO-B, respectively. The magnetic fields correspond to positive (green, outward arrow) and negative polarities (pink, inward arrow). Right: jet trajectory overplotted by PFSS open magnetic field lines. |
| In the text | |
|
Fig. 8 Solar wind and magnetic field measurements from 16 to 21 July 2014 (red: STEREO-A, blue: STEREO-B). From top to bottom: solar wind proton speed, proton density, proton temperature, magnetic field magnitude, magnetic field latitudinal, and longitudinal angles. The dashed line shows the SEP onset. |
| In the text | |
Current usage metrics show cumulative count of Article Views (full-text article views including HTML views, PDF and ePub downloads, according to the available data) and Abstracts Views on Vision4Press platform.
Data correspond to usage on the plateform after 2015. The current usage metrics is available 48-96 hours after online publication and is updated daily on week days.
Initial download of the metrics may take a while.