Fig. 3
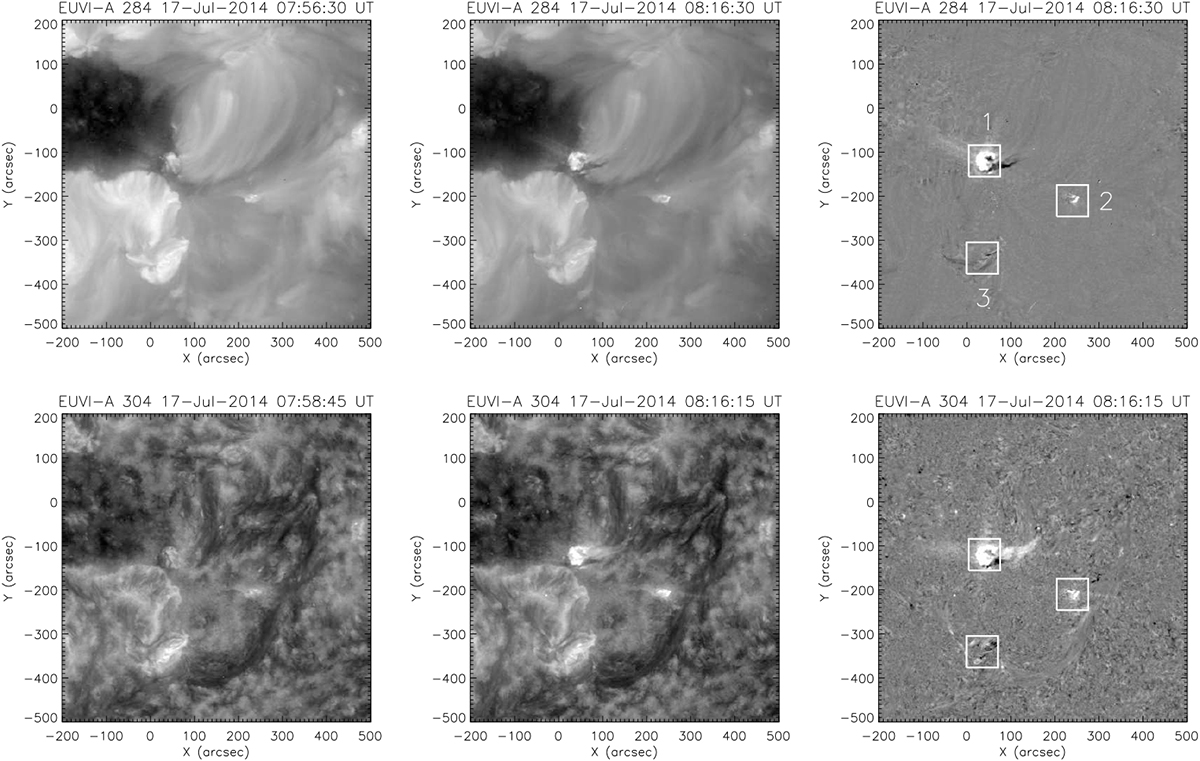
STEREO-A/EUVI images (top: 284 Å, bottom: 304 Å) showing the coronal hole and the flaring regions during the SEP event on 17 July 2014. The left panels show a pre-event image, the middle panels show snapshots close to the event peak, and the right panels show the ratio between the two images to highlight the differences. The boxes indicate regions in which changes are observed. Region [1] shows the strongest flare brightening and produced a very long jet (see Fig. 6).
Current usage metrics show cumulative count of Article Views (full-text article views including HTML views, PDF and ePub downloads, according to the available data) and Abstracts Views on Vision4Press platform.
Data correspond to usage on the plateform after 2015. The current usage metrics is available 48-96 hours after online publication and is updated daily on week days.
Initial download of the metrics may take a while.