Fig. 4.
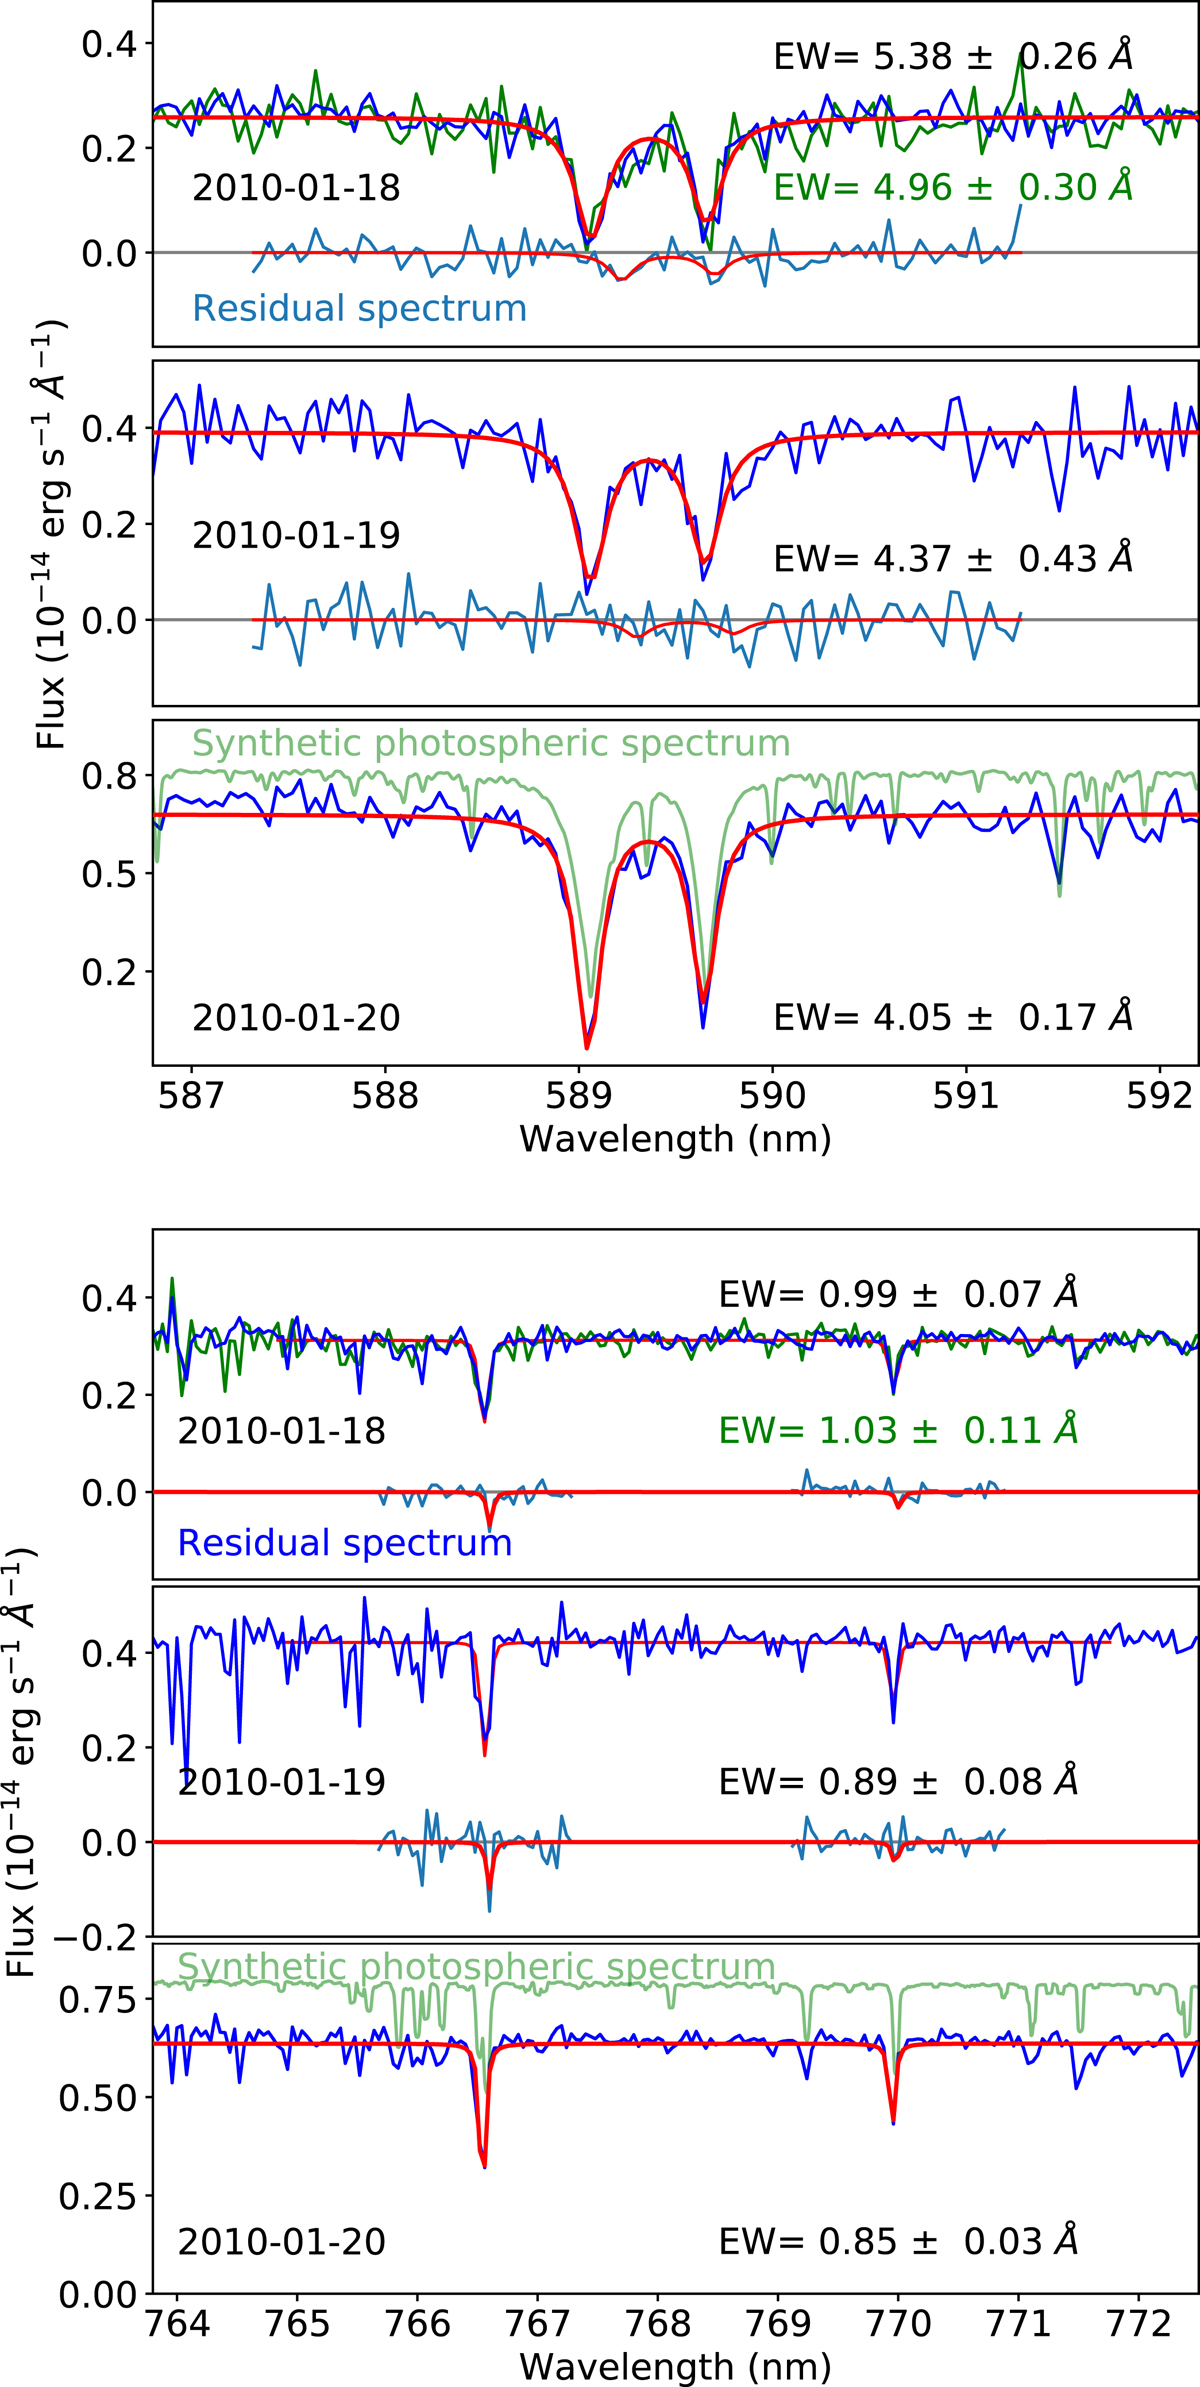
Top: Na absorption lines. Bottom: K absorption lines. The photospheric spectrum is based on the PHOENIX model described in the text. The residual spectrum is the spectrum minus the brightest spectrum (2010-01-20, the brightest spectrum was normalized to the same continuum level prior to subtraction, the two 2010-01-18 spectra were averaged prior to subtraction). The fit is shown in red (only for the longer spectrum from 20 Jan. for clarity).
Current usage metrics show cumulative count of Article Views (full-text article views including HTML views, PDF and ePub downloads, according to the available data) and Abstracts Views on Vision4Press platform.
Data correspond to usage on the plateform after 2015. The current usage metrics is available 48-96 hours after online publication and is updated daily on week days.
Initial download of the metrics may take a while.