Fig. 3.
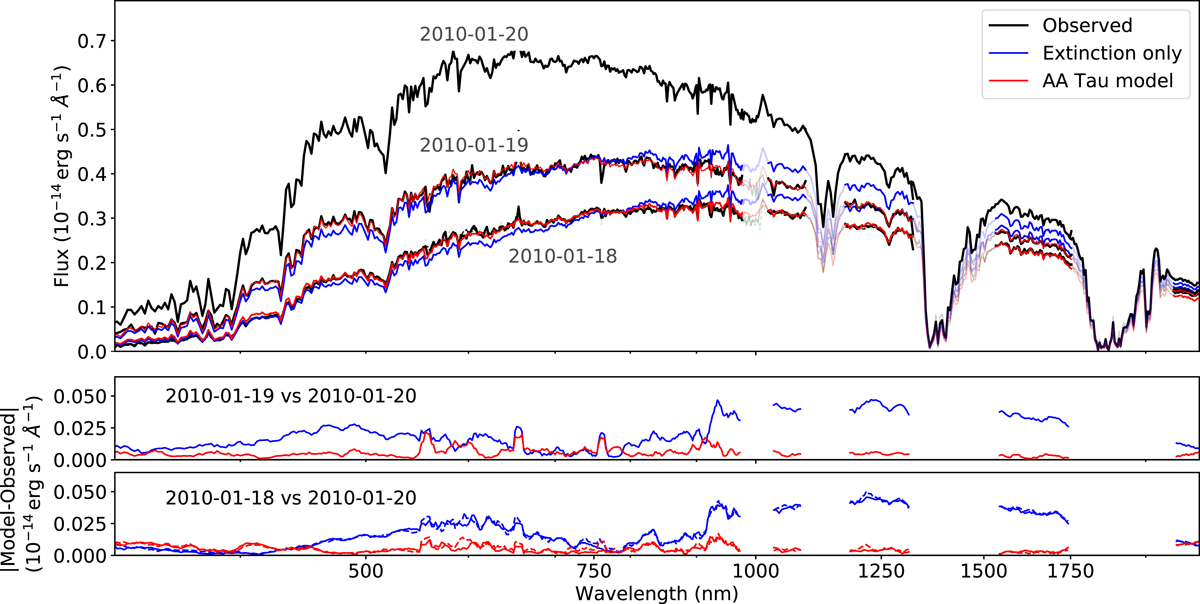
Top panel: observed spectral energy distributions. Bottom two panels: absolute difference between model and observed spectra. Models for the dimmer spectra (18 and 19 Jan.) assume that the difference between the brightest spectrum (20 Jan.) and the dimmer spectra is caused (1) only by additional extinction allowing E(B – V) and RV to vary (blue), and (2) our AA Tau model in red (see text for a detailed description). To differentiate between the two 18 Jan. spectra, the shorter one is displayed as a dashed line. Spectral ranges strongly affected by telluric absorption are removed from the fit and shown in lighter colors. The parameters corresponding to the blue and red curves in the bottom two panels are given in Table 2.
Current usage metrics show cumulative count of Article Views (full-text article views including HTML views, PDF and ePub downloads, according to the available data) and Abstracts Views on Vision4Press platform.
Data correspond to usage on the plateform after 2015. The current usage metrics is available 48-96 hours after online publication and is updated daily on week days.
Initial download of the metrics may take a while.