| Issue |
A&A
Volume 614, June 2018
|
|
|---|---|---|
| Article Number | A146 | |
| Number of page(s) | 15 | |
| Section | Galactic structure, stellar clusters and populations | |
| DOI | https://doi.org/10.1051/0004-6361/201731957 | |
| Published online | 28 June 2018 | |
Galactic or extragalactic chemical tagging for NGC 3201?
Discovery of an anomalous CN–CH relation★,★★
1
European Southern Observatory,
Alonso de Córdova 3107,
Santiago,
Chile
e-mail: This email address is being protected from spambots. You need JavaScript enabled to view it.
2
Instituto de Física y Astronomía, Facultad de Ciencias, Universidad de Valparaíso,
Casilla 5030,
Valparaíso,
Chile
3
Núcleo de Matemáticas, Física y Estadística, Facultad de Ciencias, Universidad Mayor,
Santiago,
Chile
4
Observatório do Valongo, Universidade Federal do Rio de Janeiro, Ladeira Pedro Antônio,
43, Saúde
20080-090,
Rio de Janeiro,
Brazil
5
Observatório Nacional, Rua Gal. José Cristino 77,
São Cristóvão, 20921-400
RJ, Rio de Janeiro,
Brazil
6
Observatorio Astronómico, Universidad Nacional de Córdoba,
Laprida 854,
Córdoba,
CP 5000,
Argentina
7
National Research Institute of Astronomy and Geophysics (NRIAG),
11421,
Helwan, Cairo,
Egypt
Received:
14
September
2017
Accepted:
5
March
2018
Abstract
Context. The origin of the globular cluster (GC) NGC 3201 is under debate. Its retrograde orbit points to an extragalactic origin, but no further chemical evidence supports this idea. Light-element chemical abundances are useful to tag GCs and can be used to shed light on this discussion.
Aims. Recently it was shown that the CN and CH indices are useful to identify GCs that are anomalous to those typically found in the Milky Way. A possible origin of anomalous clusters is the merger of two GCs and/or the nucleus of a dwarf galaxy. We aim to derive CN and CH band strengths for red giant stars in NGC3201 and compare these with photometric indices and high-resolution spectroscopy and discuss in the context of GC chemical tagging.
Methods. We measure molecular band indices of S(3839) and G4300 for CN and CH, respectively from low-resolution spectra of red giant stars. Gravity and temperature effects are removed. Photometric indices are used to indicate further chemical information on C+N+O or s-process element abundances that are not derived from low-resolution spectra.
Results. We found three groups in the CN–CH distribution. A main sequence (S1), a secondary less-populated sequence (S2), and a group of peculiar (pec) CN-weak and CH-weak stars, one of which was previously known. The three groups seem to have different C+N+O and/or s-process element abundances, to be confirmed by high-resolution spectroscopy. These are typical characteristics of anomalous GCs. The CN distribution of NGC 3201 is quadrimodal, which is more common in anomalous clusters. However, NGC 3201 does not belong to the trend of anomalous GCs in the mass-size relation.
Conclusions. The globular cluster NGC 3201 shows signs that it can be chemically tagged as anomalous: it has an unusual CN–CH relation, indications that pec-S1-S2 is an increasing sequence of C+N+O or s-process element abundances, and a multi-modal CN distribution that seems to correlate with s-process element abundances. The non-anomalous characteristics are that it has a debatable Fe-spread and it does not follow the trend of mass size of all anomalous clusters. Three scenarios are postulated here: (i) if the sequence pec-S1-S2 has increasing C+N+O and s-process element abundances, NGC 3201 would be the first anomalous GC outside of the mass-size relation; (ii) if the abundances are almost constant, NGC 3201 would be the first non-anomalous GC with multiple CN–CH anti-correlation groups; or (iii) it would be the first anomalous GC without variations in C+N+O and s-process element abundances. In all cases, the definition of anomalous clusters and the scenario in which they have an extragalactic origin must be revised.
Key words: globular clusters: individual: NGC 3201 / stars: abundances / Galaxy: halo / stars: population II
Observations done under programme 60.A-9501(B) at NTT/ESO, La Silla; and archival data from project 60.A-9700(D).
Table 2 is also available at the CDS via anonymous ftp to cdsarc.u-strasbg.fr (130.79.128.5) or via http://cdsarc.u-strasbg.fr/viz-bin/qcat?J/A+A/614/A146
© ESO 2018
1 Introduction
The paradigm that defines globular clusters (GCs) has slowly changed since the first studies pointing to multiple populations such as Cottrell & Da Costa (1981) and Norris et al. (1981). A substantial amount of work has been done based on high-resolution spectroscopic and photometric observations during the last two decades. It is well known that all globular clusters present a star-to-star variation of light-element abundances, such as the Na–O anti-correlation (e.g. Gratton et al. 2004, 2012) or the C–N anti-correlation (e.g. Cohen et al. 2002; Briley et al. 2004; Da Costa et al. 2004; Kayser et al. 2008; Pancino et al. 2010; Smolinski et al. 2011). The most plausible scenario to explain the anti-correlations is self-enrichment (e.g. Prantzos & Charbonnel 2006), where the nature of the polluters is the current open question of this field. Asymptotic giant branch (AGB) stellar ejecta (e.g. D’Ercole et al. 2008), fast-rotating massive stars (e.g. Decressin et al. 2007), and massive binaries (e.g. de Mink et al. 2009) are among the possible candidates. In all cases, nucleosynthesis and stellar evolution have been discarded because un-evolved main sequence stars also present the anti-correlations above (e.g. Briley et al. 1994; Kayser et al. 2008; Pancino et al. 2010; Milone et al. 2013). Therefore the origin of the primordial chemical anomalies in GCs is environmental and still remains unknown (see e.g. Renzini et al. 2015). For an updated review on the recent scenarios and comparisons with observational constraints we refer to Bastian & Lardo (2018).
A few GCs also present a star-to-star spread in metallicity, C+N+O, and s-process element abundances, where each group has a spread in p-capture element abundances, such as Na–O and C–N anti-correlation, for all cases when abundances are available (more details in Da Costa 2016; Marino et al. 2015). They are called anomalous GCs and are usually associated to a peculiar formation and evolution history, possibly originating in dwarf galaxies that were captured by the Milky Way (e.g. Da Costa 2016). They are important targets to be analysed also in terms of light-element anti-correlations described above to characterise these clusters as typical globular clusters or anomalous. One of these targets is M 22 (Da Costa et al. 2009; Marino et al. 2009), although Mucciarelli et al. (2015b) argued against a [Fe/H] spread for M 22. Marino et al. (2011) showed that the CN index S(3839) traces [N/Fe] and the CH index G4300 traces [C/Fe]; they split the stars into two groups in terms of s-process element abundances.The s-poor group has a bimodal C–N anti-correlation, as expected from CNO-cycle enrichment, and the s-rich group also has an anti-correlation but the sample is small, therefore it is not possible to say whether the distribution is bifurcated or not. Consequently M 22 presents two groups with C–N anti-correlation and not a broad correlation as Norris & Freeman (1983) concluded (see also Lim et al. 2017).
The anomalous cluster NGC 1851 is also potentially a result of the merger of two globular clusters (Carretta et al. 2010). As in the case of M 22, no CN–CH anti-correlation was found at first sight by Lardo et al. (2012). However, a more detailed analysis revealed a strong anti-correlation of [C/Fe] and [N/Fe] by Lardo et al. Another interesting result is that NGC 1851 does not present a bimodal distribution of CN nor [N/Fe], but does present a quadrimodal CN distribution as shown by Campbell et al. (2012). A closer look at the bimodal CN distribution of M 22 also reveals a quadrimodal distribution (see Sect. 4.3.) A difference between M 22 and NGC 1851 is that the latter presents a diffuse stellar halo that could be a remnant of its host dwarf galaxy after being captured by the Milky Way (Olszewski et al. 2009; Bekki & Yong 2012). However, if M 22 had a stellar halo, it was possibly stripped off because the cluster is closer to the Galactic centre (Da Costa 2016). In conclusion, the formation scenario for both M 22 and NGC 1851 points to a merger of globular clusters, however the details may not be entirely the same. A few other anomalous clusters can be added to this group: NGC 5286, M 2, NGC 5824, M 19, M 54, and M 75 (Da Costa 2016; Marino et al. 2015).
Another intriguing cluster is NGC 3201. Although Simmerer et al. (2013) showed that this object is among the clusters with an intrinsic [Fe/H] spread, other works have strongly suggested otherwise (Covey et al. 2003; Muñoz et al. 2013; Mucciarelli et al. 2015a). Nevertheless, NGC 3201 has a retrograde orbit (Gonzalez & Wallerstein 1998), which indicates a contentious history for this GC, with a possible extragalactic origin, similar to the case of ωCen (Bekki & Freeman 2003). It is a good candidate to present a peculiar CN–CH relation as in the case of M 22. Smith & Norris (1982) found a bimodal distribution of CN for NGC 3201 red giant branch (RGB) stars, but not as marked as for other typical GCs, such as NGC 6752 and M 4. They also found a mild CN–CH anti-correlation but with one star that was CN-weak and CH-weak, in agreement with Da Costa et al. (1981). A new analysis of CN and CH for NGC 3201 in comparison with the latest high-resolution spectroscopy, photometric data, and CN and CH of typical and anomalous GCs is needed. In this work we analyse CN and CH indices of RGB stars from NGC 3201, and discuss the origin of this GC as done for other anomalous GCs.
The paper is organised as follows. In Sect. 2 we describe the photometric and spectroscopic observations. The spectroscopic analysis and calibrations are done in Sect. 3. The multiple stellar generations of NGC 3201 are discussed in Sect. 4 and compared to other anomalous clusters. Finally in Sect. 5 we discuss the origin of NGC 3201. Summary and conclusions are given in Sect. 6.
2 The data
2.1 Target selection from pre-images
The observations were carried out using the European Southern Observatory (ESO) Faint Object Spectrograph and Camera (v.2), EFOSC2 (Snodgrass et al. 2008), mounted on the 3.6 m New Technology Telescope (NTT) at the ESO-La Silla Observatory, Chile. We used archival images in B and V filters centred at NGC3201 to select RGB stars and prepare the masks in this region. To obtain more RGB stars we observed additional pointings to the north and to the south of the cluster; we observed also in B and V filters and kept half of the cluster in the field of view of 4′ × 4′ (see Table 1). Data reduction was done using ESO pipeline esorex1.
To select RGB stars we carried out point spread function (PSF) photometry on B and V images using default procedures with DAOPHOT at Image Reduction and Analysis Facility Software (IRAF; Stetson 1987). From the colour-magnitude diagram (CMD, see Fig. 1) we selected all RGB stars brighter than V < 15 and identified them in the pre-image. We note that the broad RGB is due to differential reddening (Kravtsov et al. 2009; von Braun & Mateo 2001). We selected the best targets that would provide spectra with features of CN, CH, and Fe on the detector without overlapping with neighbouring stars. In total we selected 46 RGB stars in NGC 3201. From Fig. 1b one star is located at the AGB phase at about V ~ 13.4 mag and a further three brighter stars at about V ~ 13.0 mag cannot be clearly tagged as RGB or AGB. We note that these stars do not change the trends discussed in the plots, therefore we keep them in our analysis.
We note that all other stars are located at the upper RGB, that is, during the RGB bump or above it. Gratton et al. (2000) discussed how the mixing that takes place at the RGB bump changes the abundances of C and N with respect to the lower RGB abundances (see also the review by Salaris et al. 2002). These changes do not imply changes in the CN–CH distributions, as we show in thispaper.
The estimation of the RGB bump magnitude was done at a first approximation based on the equation as a function of metallicity by Salaris et al. (2002) that results in 0.47 mag above the horizontal branch (V = 14.8 mag, Harris 1996, 2010 edition). However, the empirical and theoretical values differ by about 0.2 to 0.4 mag at the metallicity of NGC 3201 ([Fe/H] = − 1.46, see e.g. Riello et al. 2003; Di Cecco et al. 2010). Therefore, it is fair to say that the RGB bump of NGC 3201 is at V ~ 14.7 mag. This is the value estimated by Kravtsov et al. (2009) with the same photometric data. In panels c and d of Fig. 1 we show theluminosity function of all stars and RGB stars respectively, indicating the over densities of the horizontal branch and RGB bump, which agree with the expected values.
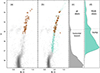 |
Fig. 1 Colour-magnitude diagram (CMD) of NGC 3201 and selected stars for spectroscopic observations. Panel a: Photometry from pre-images as described in the text. No calibration or de-reddening process was done, except by a zero point offset to match the calibrated CMD from panel b. Targets for spectroscopic observations were selected from this CMD and are shown as orange circles. Panel b: Same as (a) but using photometry from Kravtsov et al. (2009) that is calibrated and corrected by differential reddening. The selected targets are identified and reveal an outlier from the RGB region that should be excluded from our analysis. Moreover, RGB stars are colour-coded. Panel c: Luminosity function of all stars from (b) indicating the over density of the horizontal branch. Panel d: Luminosity function only of RGB stars from (b) indicating the over density of the RGB bump. |
2.2 Spectroscopic observations
After selecting the targets and preparing the masks, we performed the spectroscopic observations in Multi Object Spectroscopy (MOS) mode of EFOSC2. For each pointing (centre, north, south) we took three observations of 20 minutes each to reach enough signal-to-noise (S/N) and to correct cosmic rays. We used grism #07, which covers the blue region from 3270 to 5240Å, slit width 1.34′′, and length 8.6′′, which means a spectral resolution of Δλ = 7.4 Å, or R ≈ 500. The pixel scale is 0.12′′, and we chose binned readout mode 2 × 2 that makes the pixel scale be 0.24′′. Data reduction was done also using the ESO pipeline esorex. Each spectra was normalised locally to measure each index of CNand CH separately. For the CN index, we fitted a straight line to the two pseudo-continua defined by Pickles (1985), and for CH we proceeded in the same way using the two pseudo-continua defined by Harbeck et al. (2003). Table 1 gives further information.
3 Spectroscopic analysis
3.1 Membership selection
From 48 spectra observed, we excluded six that did not have enough coverage to measure a CN index. These include the AGB star with V = 13.2 magand one of the RGB tip stars. Two stars were observed twice and we excluded the two spectra with the lower S/N. From the 40 remaining spectra, 12 were excluded because they had S/NCN ≤ 25 (i.e. S/NCH ≤ 55), which implies σCN ≥ 0.06 and σCH ≥ 0.03 as shown in Fig. B.1. Amongthem is the outlier at (V, B − V) = (15.1, 1.3). We ended up with a sample of 28 valid spectra. The other three RGB tip stars are not biased to any particular group in Fig. 2, two are S1, and the other is pec.
To ensure that we are studying stars only from NGC 3201, member stars were selected using the traditional plot of Fe abundance versus heliocentric velocity (Fig. 2). We derived radial velocities of the individual stars using the cross-correlation python package crosscorrRV2. This package calculates the radial velocity of stars shifting the rest-frame wavelength axis of a template. We used as template a synthetic spectrum (Coelho et al. 20053) for a typical red giant star in NGC 3201 with parameters Teff = 5000 K, log(g) = 1.0, [Fe/H] = − 1.5, and [α/Fe] = +0.4. The resolution of the synthetic spectrum (Δλ ≈ 0.2) was degraded using IRAF task Gauss to match the resolution of the stellar spectra of our sample (Δ λ ≈ 7.4). We performed cross correlation using the K and H Calcium lines region (3933.66 Å and 3968.47 Å). We also corrected the radial velocities from the motion of the Earth to the heliocentric reference using the python package helcorr2. Errors were assumed to be the full width at half maximum (FWHM) of the cross-correlation function, which is about 5 km s−1 for all spectra. Fe abundance is indicated by the Lick index Fe4383 measured with the LECTOR code4.
We ran a Besançon model5 (Robin et al. 2003) with a solid angle of 0.2 deg2 at the direction of NGC 3201 and selecting only giant, bright giant, and supergiant stars from all Galactic components with visual magnitude between 18 < V < 10. The simulation resulted in 309 stars with metallicities higher than [Fe/H] ≳ − 1.5, which is the metallicity of NGC 3201 (Dias et al. 2016b)6; only three stars had a metallicity below that. Radial velocities are indicated in Fig. 2 and show no overlap. Therefore, field stars would have vhelio < 320 km s−1 and higher metallicities, that is, they would be in the upper left quadrant, where there are no stars. In other words, all 28 valid stars were selected as members. The average velocity of the member stars is vhelio = 460 ± 63 km s−1, which is compatible with 494 km s−1 from Harris (1996, 2010 edition).
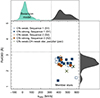 |
Fig. 2 Heliocentric velocities versus Fe4383 index for all 28 valid spectra. Smoothed histograms show the distribution of the two parameters. We also show the velocities distribution from the Besançon model. Member stars are located in the lower right quadrant indicated by the dashed lines. Sequence 1 (S1), sequence 2 (S2), and peculiar stars (pec.) defined in Fig. 5 are indicated by blue squares, orange diamonds, and green crosses, respectively. CN-strong (δS(3839) ≥ 0) and CN-weak stars (δS(3839) < 0) are represented by filled and open symbols, respectively. These symbols and colours are used also in the following figures. Dashed lines are set by eye at the lower limit of vhelio and the upper limit of Fe4383 distributions. |
Log of observations for pre-images and spectroscopy.
3.2 Definition of CN and CH indices
We adopt here the modified index definition of CN (S3839) and CH (G4300) by Harbeck et al. (2003) to have a homogeneous analysis and compare results with those from Kayser et al. (2008) who used Harbeck’s definition. The indices defined by Harbeck et al. (2003) have slightly different spectral regions with respect to the classical ones defined by Norris & Smith (1981) in order to avoid strong hydrogen lines nearby in main sequence stellar spectra. This was not an issue for the RGB stars observed in the 1980s. The differences in the indices using different definitions are briefly discussed in Sect. 4.3.
Indices from Eqs. (1) and (2) were measured using an R code7 written by B. Dias (see Fig. 3) resulting in
 (1)
(1)
 (2)
(2)
Uncertainties are discussed in Appendix B.
3.3 Surface temperature and gravity effects
Both S(3839) and G4300 indices are sensitive to surface gravity and effective temperature (see Norris & Smith 1981). Removing this dependency is a sine qua non condition for detecting their sensitivity to nitrogen and carbon. The typical proxies used to correct the indices are colour or magnitude (Norris & Smith 1981; Harbeck et al. 2003; Kayser et al. 2008; Campbell et al. 2012). We adopt here a similar method to Pancino et al. (2010) who traced a ridge line in the distribution of index versus magnitude. Instead of a ridge line we fitted a second-order polynomial to this distribution; Fig. 4 displays the polynomial fit to the data. The difference between the index and the polynomial for a given magnitude defines the excess indices δS(3839) and δG4300 that will be used in this paper from now on. We note that the spread seen in Fig. 4 is real because all member stars have σCN < 0.06 and σCH < 0.03. The parameters for all member stars are given in Table 2.
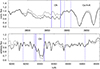 |
Fig. 3 Definition of CN and CH indices S(3839) and G4300 from Eqs. (1) and (2) using spectra of two NGC 3201 stars. Thin lines are from the CN-weak, CH-strong star N3201centre_08, thick lines are from the CN-strong, CH-weak star N3201centre_11, both S1 stars with V ≈ 13 mag. The index region is highlighted by solid blue lines and pseudo-continuum regions are identified by dashed blue lines. Spectra were locally normalised as explained in Sect. 2.2. |
4 Multiple stellar generations in NGC 3201
4.1 The unusual CN–CH anti-correlation of NGC 3201
We show in Fig. 5d the anti-correlation between the corrected indices δS(3839) and δG4300 for the 28 good quality member stars of NGC 3201. We split them into two CN–CH anti-correlation sequences, namely S1 and S2, and a group of CN-weak, CH-weak peculiar (pec) stars. We fitted a second-order polynomial to S1 and shifted the curve to match S2 and peculiars. The separation between the sequences is Δ δG4300 = 0.1 mag, which is about 7σ distance. Therefore the separation of our sample into these groups is significative and we adopt the same point colours and shapes defined in Fig. 5d to the other plots in this paper. One peculiar star was already indicated by Smith & Norris (1982) and Da Costa et al. (1981) and we now increase this sample to four peculiar stars. The other panels of Fig. 5 show that stars from different groups are indistinguishable in the Na–O anti-correlation, at least with the limited sample we have. The usual correlations Na–CN and O–CH are also shown, where first (1G, Na-poor, CN-weak) and second generation (2G, Na-rich, CN-strong) stars can be identified.
The globular cluster M 22 also has two sequences of C–N anti-correlation and the C-rich sequence is less populous than the C-poor sequence as in the case of S2 in comparison with S1 for NGC 3201. In the case of M 22, s-process element abundances were available and the conclusion of Marino et al. (2011) was that the C-poor/N-poor sequence (equivalent to S1) is s-poor and Fe-poor, while the C-rich/N-rich sequence (equivalent to S2) is s-rich and Fe-rich. Oxygen is the same for the two groups, but C+N+O is higher for the s-rich stars. High-resolution spectroscopy is needed to confirm whether NGC 3201 has an increasing C+N+O and s-process element abundances in the sequence S1–S2 as well. Gonzalez & Wallerstein (1998) found hints that O-rich NGC 3201 stars are depleted in [Ba/Eu]. In Fig. 5 we show that O-rich stars are C-rich, which would mean that the sequence pec-S1–S2 has decreasing s-element abundances, not increasing as is the case for M 22. However, 11 out of the 13 stars studied by Gonzalez & Wallerstein have constant [Ba/Eu] abundance ratios, and only two O-rich stars are depleted in Ba. A larger sample, preferably including the pec-S1-S2 stars, is needed in order to derive abundances of C, N, O, and s-/r-process elements.
Lim et al. (2017) analysed the double CN–CH anti-correlation of M 22 in a different way. They argued that these stars show a positive CN–CH correlation, which is also the case for other anomalous clusters such as NGC 1851, NGC 6273, and NGC 5286. They showed that the CN-strong stars are s-rich, and CN-weak stars are s-poor. NGC 288 was used as reference and it shows only a single anti-correlation. If the CN–CH relation of NGC 3201 stars is interpreted following this line, it is another indication that the sequence pec-S1-S2 may have increasing s-element abundances and possibly increasing metallicities.
The CN–CH anti-correlation can be explained by CN-cycle processing. Some clusters show that C+N increases with decreasing C (e.g. M 5; Cohen et al. 2002) and ON-cycle processed material is required to explain that. During the first dredge-up, the convective envelope of an RGB star can move material processed during the CNO cycle up to the atmosphere. However, for metal-poor stars, the convective envelope does not go deep enough to reach the H-burning shell to mix enhanced (or depleted) CNO-cycle processed elements8. NGC 3201 is relatively metal-poor, but S1, S2, and peculiar stars have different CH strength (proxy for C) and we can only speculate that these three groups may have different C+N abundances.
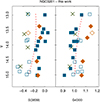 |
Fig. 4 Correction of S(3839) and G4300 for stellar surface temperature and gravity for 28 member and good quality (S/NCN≥ 25) RGB stars of NGC 3201. We fitted a second-order polynomial to each dataset, which is represented by the red dashed lines. The difference between the indices and the fitted line for a given magnitude defines δS(3839) and δG4300. Symbols arethe same as in Fig. 2. If the peculiar stars indicated by the crosses are not considered, two groups of stars with anti-correlated CN and CH can be identified: S1, indicated by squares, and S2, indicated by diamonds (see also Fig. 5 and discussions). Error bars are of the order of the point size, and are thus omitted in the plots. |
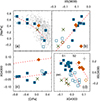 |
Fig. 5 Panel a: Na–O anti-correlation for all globular clusters from Carretta et al. (2009) in grey dots superimposed by the 11 NGC 3201 stars in common with our sample with available [Na/Fe] and [O/Fe]; symbols are the same as in Fig. 2. Smooth spline function is shown as red dashed line to highlight the anti-correlation in our data. Peculiar stars indicated by green crosses are not considered in the fitted function based on the selection of panel d. Panel b: Correlation between sodium and cyanogen, which is a proxy for nitrogen abundances for the 18 stars in common with available [Na/Fe]. A straight line is fitted to S1 stars. Panel c: Same as (b) but for CH and oxygen for stars in common with available [O/Fe]. The fitted line is shifted by 0.1 mag in δG4300 to match the only S2 star. Panel d: Distribution of CN and CH indices for all 28 NGC 3201 good quality member stars, revealing three groups of stars: sequence 1 (S1), sequence 2 (S2), and peculiar (pec). A second-order polynomial was fitted to S1 stars and the same curve was shifted by 0.1 mag in δG4300 as in panel c to match the S2 stars, and by − 0.1 mag to match the peculiar stars. Mean uncertainties are shown by the cross on the upper right corner of the panel. |
Final parameters for all 28 good quality member stars of NGC 3201.
4.2 Seeking a photometric index that splits pec-S1-S2 stars
Monelli et al. (2013) defined a colour index based on Johnson filters U, B, I as given by the equation
 (3)
(3)
They found that the V −cU,B,I diagram reveals a split RGB for all globular clusters analysed, after differential reddening correction. The multiple branches correlate with the chemical abundances of light-elements O, Na, C, N, and Al.
We adopted the available UBVI photometry corrected by differential reddening by Kravtsov et al. (2009) to produce a V-cU,B,I diagram for NGC 3201. In Fig. 6 we show the sky distribution of the stars from Kravtsov et al. (2009) and identifythe core radius and half-light radius, as well as our 28 targets. We plotted the pseudo-CMD, aka V −cU,B,I diagram, using stars from Fig. 6 and displayed them on Fig. 7. We also fitted a second-order polynomial to all RGB stars within a box defined by 12 < V < 16 mag and − 2.0 < cU,B,I < −1.7 mag. In a similar way to what it was done to correct S(3839) to δS(3839), we define δcU,B,I as the difference between cU,B,I and the fitted line for a given V magnitude.
The corrected spectroscopic index δS(3839) is plotted against the corrected photometric index δcU,B,I on the upper panels of Fig. 7. Stars fainter than V > 14 mag have larger photometric uncertainties and generate dispersion on the plot. If only bright stars are plotted, a correlation between these indices is clearly seen, as expected, and 1G and 2G stars are well separated. However, pec-S1-S2 stars are all mixed. In conclusion, δcU,B,I cannot split the three groups.
UV filters are also useful to split the RGB of globular clusters. The Hubble Space Telescope (HST) Large Legacy Treasury Program (Piotto et al. 2015) had its first public data release with the homogeneous photometric catalogues published recently (Soto et al. 2017). This release is preliminary, therefore no differential reddening correction was taken into account, which could cause some dispersion on the photometric indices but not as much as ground-based photometry. This team defined the colour index that is very sensitive to nitrogen abundances and is useful to disentangle 1G and 2G RGB stars in globular clusters.
 (4)
(4)
The lower left panel of Fig. 8 shows the V −δcF275W,F336W,F438W diagram where the S2 CN-strong stars fall in between the CN-strong and CN-weak stars of S1, which is a possible explanation for why the RGB is not clearly bimodal but rather has a smooth transition. If S2 stars are indeed s-rich and S1 s-poor, the RGB in this CMD would have s-poor stars in the left branch and mixed s-poor and s-rich stars towards the right branch. We notice that the S1-1G star to the right is likely to be there because it has δS(3839) very close to zero and is therefore more sensitive to our definition of CN-strong and CN-weak with a cut at δS(3839) = 0. This CMD seems useful to split S1-2G from the others. As done for cU,B,I we also fitted a line to the RGB stars and defined the differential index δcF275W,F336W,F438W as the difference between cF275W,F336W,F438W and the fitted line for a given magnitude. The correlation between δcF275W,F336W,F438W and δS(3839) on the upper left panel is clear, as expected. It splits 1G and 2G stars but mixes S1 and S2 stars. Interestingly, peculiar stars seem to have lower δcF275W,F336W,F438W values for the same δS(3839) as the 1G stars. This correlation seems useful to find peculiar stars.
Milone et al. (2017) defined the so-called “chromosome map” that consists of a plot of the pseudo colour index δcF275W,F336W,F438W versus the colour index δcF275W,F814W. On the first data release of the HST UV treasury, the F814W magnitude was not yet available, but the authors provide an I magnitude which is very similar. We replaced mF814W by I and produced our version of the “chromosome map” as shown on the upper right panel of Fig. 8. The regions of 1G and 2G stars are clearly identified and split by a line inclined by θ = 18° as defined by Milone et al. (2017). Stars of type S1 follow the 1G–2G split (with the outlier being explained above). Stars of type S2 are not consistent with an additional 1G or 2G sequence shifted from the main 1G or 2G regions, as is the case for other anomalous clusters (type II in the nomenclature of Milone et al. 2017) such as M 22 and NGC 1851. In fact, Milone et al. (2017) classified NGC 3201 as type I. In conclusion, the chromosome map is not able to split pec-S1-S2 stars.
A third photometric index was defined by Marino et al. (2015) based on the Johnson filters B, V, I as given by
 (5)
(5)
These authors say that cB,V,I is not very sensitive to Na or N, but it was useful to separate s-rich and s-poor stars on NGC 5286. Although s-process element abundances do not directly affect broad-band filters, at least indirectly this index was able to split well the two groups of stars. They further claim that C+N+O abundances may also affect this index. In fact, s-rich stars are also rich in C+N+O in anomalous clusters. We use again the photometry from Kravtsov et al. (2009) to compare the photometric index with our spectroscopic measurements.
We show in Fig. 9 a similar CMD to the one done in Fig. 7 but now with the colour defined by Eq. (5). We defined the differential index δcB,V,I in a similar way to that for δcU,B,I. Only stars brighter than V < 14 are analysed as before. All S2 stars are to the right of the fitted line, the pec are to the left, and S1 stars are spread around the curve. Kernel density estimations (KDEs) were produced for these stars separated into pec-S1-S2, and bandwidth as the average uncertainty. Although the KDEs are broad, it is possible to identify that the peaks follow the sequence pec-S1-S2 in terms of increasing δcB,V,I. In conclusion, δcB,V,I is able to split pec-S1-S2 NGC 3201 stars, even if not as clearly as for NGC 5286. If this index is able to split groups of stars with different C+N+O abundance and possibly s-process element abundances, NGC 3201 could join the group of anomalous clusters.
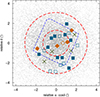 |
Fig. 6 Spatial distribution of NGC 3201 stars from Kravtsov et al. (2009) in grey dots with a greyscale density pattern. Spectroscopic targets are shown with the same symbols as in Fig. 2 for the 28 good quality member stars. Dashed outer circle shows the half-light radius (rh = 3.1′), the internal dashed red circle is the core radius (rc = 1.3′), and the blue dashed square delimits the region of the HST observations used here. |
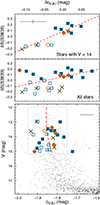 |
Fig. 7 Bottom panel: V −cU,B,I diagram for NGC 3201 using photometry from Kravtsov et al. (2009) corrected by differential reddening but without decontamination from field stars. We selected a rectangle around the RGB stars and fitted a second-order polynomial shown by a dashed red line. This line is used to define δcU,B,I as the difference between cU,B,I and the fitted line for a given V magnitudefor the 28 stars analysed here. Symbols are the same as in Fig. 2. Average error bars are indicated at the upper right corner. Middle panel: correlation between δS(3839) and δcU,B,I for all 28 stars. A linear fit to the S1 stars is shown by a red dashed line. Upper panel: same as middle panel but only for the 14 stars brighter than V < 14 mag. Average error bars are indicated at the upper left corner. |
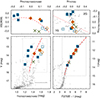 |
Fig. 8 Similar to Fig. 7 but using HST UV photometry from Soto et al. (2017), available only for 12 out of the 19 good quality member stars within the HST field of view (See Fig. 6). The bottom panels show the CMDs with our spectroscopic targets identified using the same symbols as in Fig. 2. The index δcF275W,F336W,F438W is plotted against δS(3839) on the upper left panel. A second-order polynomial was fitted to S1 stars, and it is shown as red dashed line. The index δcF275W,F336W,F438W is plotted also against δcF275W,I on the upper right panel, which is a version of the so-called “chromosome map” from Milone et al. (2017) that distinguishes 1G and 2G stars, split by a line inclined by θ = 18°. Our spectroscopic targets are identified on the map. |
4.3 CN distribution
Campbell et al. (2012) revealed a quadrimodal CN distribution for the anomalous cluster NGC 1851. It is known that the more metal-rich the cluster the larger range its CN distribution has (e.g. Kayser et al. 2008; Schiavon et al. 2017; Milone et al. 2017), therefore Campbell et al. compared NGC 1851 with NGC 288 that has a similar metallicity ([Fe/H] = -1.19, Dias et al. 2016b). They concluded that both clusters indeed have similar ranges on the CN distribution, but NGC 288, taken as a typical globular cluster, has a clearly bimodal distribution, while NGC 1851 has a quadrimodal distribution. Moreover, they showed that the two CN-strong peaks are also Ba-rich, and the other two peaks are Ba-poor. We discuss whether a quadrimodal CN distribution can be another indicator of anomalous clusters.
In order to compare NGC 3201 with other clusters, we produced the KDE for each cluster shown in Fig. 10 using the indices from the RGB stars of Kayser et al. (2008) corrected following Appendix A. The KDE smoothing bandwidth was considered as the average index uncertainty of each cluster. For each distribution we fitted the minimum number of Gaussian functions that was needed to converge the fit using non-linear least squares9. They are shown in the figure and represent well the KDEs. The sigma of each Gaussian was forced to be similar to the average index uncertainty in each case. A possible check of the significance of the multi-Gaussian fit is the number of degrees of freedom. Each Gaussian has two variables to be fit, therefore at least three points per Gaussian are needed in order to give flexibility for the fit to proceed. For NGC 288, two Gaussians were fitted to 16 points, which is more than six, hence the result does not over-fit the KDE. The same applies for all other clusters.
The CN distribution for all 28 good quality member RGB stars from our NGC 3201 sample shows four peaks (see Fig. 10). This is not similar to the bimodal CN distribution of typical Milky Way GCs NGC 288 and NGC 36210, even thoughit covers the same range and the stars have similar metallicities. We also compare with the CN distribution of the anomalous cluster M 22, that presents two peaks with an uneven distribution. Although it does not have four peaks like NGC 1851, the CN-strong stars are s-rich and CN-weak are s-poor (e.g. Marino et al. 2011). The three bottom panels show the KDEs of our sample divided into pec, S1, and S2. We argued before about the possibility of an increasing s-process element abundance from pec to S2. Here we show that, in fact, pec stars are all CN-weak and S2 stars are predominantly CN-strong. Stars of type S1 cover the full range.
We also checked the stability of the δS(3839) distribution shape considering another definition for this index applied by Smith & Norris (1982) that uses slightly different wavelength limits. They analysed the NGC 3201 CN distribution for RGB stars brighter than V < 14 mag and only had one peculiar star in their sample. They found a bimodal distribution with no sharp separation between the peaks. We applied the same strategy as above and scaled S(3839) to δS(3839) from Smith & Norris (1982) in the same way we did for our data and for Kayser et al. (Appendix A). The resulting curves are shown in Fig. 11 assuming a constant error bar of 0.05 dex as the KDE bandwidth. We reproduce the four bottom panels of Fig. 10 on the four bottom panels of Fig. 11, but now using the same S(3839) definition as in Smith & Norris for a fair comparison. Their KDE presents three peaks while ours have five. This difference is probably because we have less stars and smaller error bars, therefore our results are more sensitive to individual isolated points. Nevertheless both samples cover the same CN range and have a dominant 1G population and a multi-peak 2G population. If our curves for NGC 3201 are compared between Figs. 10 and 11, both present a dominant 1G peak and a 2G multi-peak population. The separation in pec., S1, and S2 is also similar.
Norris & Freeman (1983) observed 100 stars in M 22 and we show their CN distribution in Fig. 11. It is comparable to the distribution shown in Fig. 10 with data from Kayser et al. (2008). The main difference is that Norris & Freeman have many more stars and their data reveal two additional extreme peaks with CN-stronger and CN-weaker stars. In other words, M 22 also has a quadrimodal CN distribution with a division of s-rich and s-poor stars as in the case of NGC 1851. In the same Fig. 11 we also show the results of NGC 1851 analysed by Campbell et al. and scaled in the same way as in Fig. 4 for consistency. The quadrimodal distribution found by Campbell et al. (2012) is still present in this plot if the right peak is ignored because it has only one star, and if the two central peaks are considered as one peak. In fact, the peaks found for NGC 1851 in the original paper do not necessarily follow a Gaussian shape. This complexity resembles that of NGC 3201 from our data.
The conclusion is that the shape of the distribution is sensitive to the definition of the index S(3839), sample size, and uncertainties. Not surprisingly, the clearly bimodal distribution of NGC 362 from Fig. 10 does not look as smooth in Smith (1983) and Norris (1987). Nevertheless, both concluded that this cluster has a bimodal CN distribution. The complexity may come from the fact that photometric indices were used instead of spectroscopic ones. More recently, Milone et al. (2017) have shown that the pair of clusters NGC 288 and NGC 362 do have a very similar chromosome map, but the latter reveals a small population of redder RGB stars, which made this cluster a type-II GC according to their classification. In other words, the CN distribution alone cannot be used to split groups of clusters, but it is certainly a valid piece of information in the vast parameter space that is required to disentangle the multiple populations within a GC and eventually correlate to global properties and environmental effects. In fact, the majority of the clusters analysed by Norris (1987) with CN distributions, by Carretta et al. (2009) with Na–O anti-correlations, and by Milone et al. (2017) with photometric chromosome maps show two main populations of stars. Any cluster that differs from that behaviour requires special treatment. We have shown in Figs. 10 and 11 that the clusters M 22, NGC 1851, and NGC 3201 do present an odd CN distribution. s-process element abundances, such as Y, Zr, Ba, La, and Nd in contrast with r-process Eu, and also C+N+O abundances are needed in order to split these sub-populations.
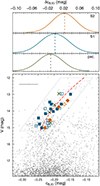 |
Fig. 9 Bottom panel: same as Fig. 7 but for the index cB,V,I defined in Eq. (5). Average error bars are indicated at the upper left corner. Top panels: the KDEs of δcB,V,I are shown for each group of stars: S1, S2, and peculiar only for stars brighter than V < 14. The KDE bandwidth is the average uncertainty of 0.03. Peak values are indicated by vertical dashed lines. |
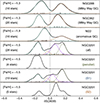 |
Fig. 10 KDE of the excess CN-index δS(3839) for NGC 3201 in comparison with two normal Galactic GCs (NGC 288, NGC 362) and one anomalous (M 22), as indicated in the panels. Data for the reference clusters were taken from Kayser et al. (2008) and put in a standard scale. The rug plot indicates the positions of all stars in each panel. The KDE bandwidth is the average uncertainty of each dataset, i.e., σNGC288 = 0.055, σNGC362 = 0.042, σM22 = 0.046, σNGC3201 = 0.031. Multi-Gaussian fitting was performed to each distribution, except pec and S2 stars, as discussed in the text. We also indicate cluster metallicities in the scale of Dias et al. (2016a). |
 |
Fig. 11 Same as Fig. 10 but with S(3839) measured following the classical definition used by Campbell et al. (2012), Norris & Freeman (1983), and Smith & Norris (1982) for a fair comparison with their results on NGC 1851, M 22, and NGC 3201, respectively.The KDE bandwith is the average uncertainty of each dataset, i.e., σNGC1851 = 0.035, σM22 = 0.07, and σNGC3201 = 0.05, respectively. The KDE bandwith for our dataset is 0.031. δS(3839) was calculated for all samples following the same strategy as done in Fig. 4. |
5 Galactic or extragalactic?
Anomalous clusters like M 22, NGC 1851, M 2, and NGC 5286 all present Fe/s-rich and Fe/s-poor stars, even though the Fe-spread is still under discussion for some of them. In all cases where abundances are available, s-rich and s-poor stars also present different abundances of C+N+O. These groups correlate well with an SGB and RGB split if appropriate colours are used in the CMD. Each group has its own Na–O and C–N anti-correlations that are typical signatures of GCs. While the explanation for the anti-correlations seems to be related to self-pollution of second generation stars by the primordial population, the split into Fe/s-rich and Fe/s-poor stars for a few anomalous clusters is not explained by the same mechanisms. Bekki & Yong (2012) proposed that such clusters could be the result of a merger of two clusters. This is likely to happen in the nucleus of dwarf galaxies where relative velocities and the volume are smaller than that of the Milky Way halo. Should this scenario be true, then the anomalous clusters would have an extragalactic origin from dwarf galaxies captured by the Milky Way (but see also Marino et al. 2015; Da Costa 2016; Bastian & Lardo 2018). We use the expression “extragalactic chemical tagging” to refer to this small group of anomalous clusters, although the accuracy of this term is still debatable and is part of a complex topic of study that has been developed in the last decade. In this context, we try to tag NGC 3201 as a anomalous GC belonging to this group or not.
In the previous section we showed that NGC 3201 presents three groups on the CN–CH correlation plot, namely pec, S1, and S2, split by 7σ in CH. An indication that these groups have different abundances of C+N+O and s-process elements was revealed by photometric indices. Another mild constraint is the CN distribution that seems to be multi-modal for anomalous clusters and this is also the case for NGC 3201. These three points indicate that NGC 3201 may be included in this selected group of globular clusters, with the note that it is possibly a transient object between typical and anomalous GCs, because the features listed above are not extreme for NGC 3201. In fact, even the star-to-star Fe spread has been discussed in the literature (see Simmerer et al. 2013; Covey et al. 2003; Muñoz et al. 2013; Mucciarelli et al. 2015a). We further note that Da Costa (2016) included M 22 to this group because it has a spread in s-process element abundances, in spite of its uncertain Fe-spread. NGC 3201 provokes a similar discussion on the Fe-spread but Da Costa did not consider this cluster anomalous because no detailed study on C+N+O and s-process elements was available yet. We have presented some indication from photometry in this direction to be confirmed by high-resolution spectroscopy.
5.1 Stellar nucleosynthesis versus environmental effects
Environmental effects such as GC merger and extragalactic origin are not the only possible explanation for the more complex GCs with unusual multiple populations. One example is NGC 2808 that presents three to five populations as shown by different analyses (e.g. Carretta 2015; Marino et al. 2017; Milone et al. 2017, and others). Stars in NGC 2808 all have the same metallicity as opposed to M 22 and NGC 1851. The five populations of NGC 2808 are characterised by large variations in light-element abundances, such as Na, O, Mg, and Al. Moreover, it was found that He abundance variations plays an important role in characterising NGC 2808 populations (e.g. Bragaglia et al. 2010; Marino et al. 2017). For reference, we note that NGC 6121 (M 4) has a similar metallicity of [Fe/H] ≈ −1.1, but shows a bimodal distribution of Na and CN (Marino et al. 2008).
A comparison cluster for NGC 3201 with similar metallicity is NGC 6752, which presents a bimodal CN distribution (Norris et al. 1981). However, high-resolution multi-band photometry and spectroscopy revealed a third population for NGC 6752 (e.g. Milone et al. 2013; Nardiello et al. 2015; Gruyters et al. 2014). The explanation is that the three populations have different light-element abundance ratios and also helium abundances (Milone et al. 2013; Nardiello et al. 2015). In fact, NGC 6752 has a complex horizontal branch morphology that may be related to He abundances (Momany et al. 2002). Therefore He, and proton-capture element abundance variations could be enough to explain multiple populations, however heavier elements such as Fe and neutron-capture (and the sum C+N+O) tend to vary within a GC only for anomalous cases such as M 22 and NGC 1851 discussed above. Yong et al. (2013) found correlations of s-process elements with Na (that correlates with CN) for NGC 6752, although very small variations of s-process element abundances were measured. No bimodality or clear separation between s-rich and s-poor stars was reported (as is the case for M 22 and NGC 1851). Yong et al. also speculated that this should be the case for all GCs if they underwent extremely accurate spectroscopic analysis. Yong et al. (2015) found no spread on the C+N+O for NGC 6752. In summary, NGC 6752 does not have two populations of s-rich (high C+N+O) and s-poor (low C+N+O), as is the case for M 22 and NGC 1851 (see also Carretta et al. 2005). The three populations found for NGC 6752 with photometry and spectroscopy are related to light-element and helium abundances. NGC 3201 has a similar metallicity and mass to NGC 6752 but differs in many other aspects: (i) it does not show a bimodal CN distribution, but a complex KDE resembling NGC 1851; (ii) CN–CH anti-correlation reveal two trends similar to the findings for M 22, as well as a group of peculiar stars; (iii) it has a much redder horizontal branch (HB) morphology that covers red and blue colours similar to but not as separated as the HB of NGC 185111 (Mackey & van den Bergh 2005). The difference in HB index is consistent with NGC 3201 being 1 Gyr younger than NGC 6752 (Rey et al. 2001; VandenBerg et al. 2013; Dias et al. 2016a).
In conclusion, if the three groups we found for NGC 3201 on our CN–CH analysis have different s-process-element and C+N+O abundances, we may consider it a study case together with the other anomalous GCs in view of the formation scenario of the merger of GCs in the nuclei of dwarf galaxies. If it only possesses a very small variation of s-process-element and C+N+O abundances, and a possible mild trend or correlation of Na(CN) with s-process-element abundances (as for NGC 6752; Yong et al. 2015), then it is either a typical GC with an odd CN–CH relation or an anomalous GC without C+N+O and s-element abundance variations. Another possibility is that NGC 3201 could be a transition cluster in the sequence of CN–CH anti-correlation to CN–CH correlation shown by Lim et al. (2017).
High-resolution spectroscopic analysis is needed at least to measure s-process-element and C+N+O abundances of the 28 NGC 3201 stars analysed here. Another analysis that may help is a second-parameter analysis between NGC 6752 and NGC 3201 to check whether only metallicity and age (plus the complex He contents of the former) are enough to explain the HB morphology differences between the clusters or if NGC 3201 needs to have He abundance variations to produce such HB.
5.2 Anomalous clusters from the nucleus of dwarf galaxies
Anomalous clusters are among the most luminous in the Milky Way. Those with MV ≲−7.9 (i.e. M ≳ 2 × 10⁵ M⊙) account for 41 out of 157 from the catalogue of Harris (1996, 2010 edition). Da Costa (2016) said that 13 of those are unstudied or poorly studied. In other words, if nine anomalous massive clusters were found among the 28 well-studied massive clusters, we can extrapolate this ratio of 32% to the total sample from the Harris catalogue and predict that about 13 massive clusters should be anomalous in the Milky Way. This is already about 50% more than the eight clusters predicted by Da Costa. Instead, if we consider clusters of all masses, the first approximation is to assume that the 70% of the catalogued clusters that have metallicity measured spectroscopically (Dias et al. 2016b) also have detailed enough studies to detect Fe-spread. In this case 8% of all clusters should be anomalous, which leads us again to a total of about 13 clusters. Assuming that for half of these clusters there was minimal spectroscopic information, then the number of anomalous GC could be doubled to 26 of all masses. Some effort has been done to find more candidates to host Fe-spread (e.g. Saviane et al. 2012). We are still far from having a complete view and a explanation for these peculiar clusters (Bastian & Lardo 2018).
We compare the structural parameters of NGC 3201 with the anomalous and to the non-peculiar massive GC NGC 6752 in Fig. 12. Mass and size were taken from Norris et al. (2014), and when not available for the GC we interpolated from the fitted relation MV from Harris (1996, edition 2010) and the masses derived by Norris et al.
 (6)
(6)
We note that all anomalous clusters follow a tight mass-size relation in a region on the plot where objects could be the result of a disruption of a nucleated dwarf galaxy (e.g. Bekki & Freeman 2003; Pfeffer & Baumgardt 2013). As we discussed before, not all massive clusters have the same characteristics and NGC 6752 is plotted to illustrate that not all GCs following this trend are anomalous. Surprisingly, NGC 3201 does not belong to the trend of anomalous clusters, despite the other common characteristics discussed in this paper. Should this trend of anomalous clusters in Fig. 12 be the locus of anomalous clusters with a possible extragalactic origin, it could mean that NGC 3201 is the first anomalous GC with a different formation scenario, or that the explanation for the origin of all anomalous clusters should be revised, including NGC 3201.
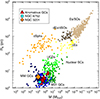 |
Fig. 12 Mass-size distribution of compact stellar systems with data from Norris et al. (2014). We highlight the nine anomalous GCs listed by Da Costa (2016) and Marino et al. (2015). We also feature NGC 3201 and the massive GC with no dispersion in Fe or s-process elements, NGC 6752. |
5.3 Anomalous clusters from the merger of two clusters
The small group of CN-weak and CH-weak peculiar stars we found in NGC 3201 is intriguing. We evaluate here a possible external origin for them. One possibility is to look at the G4300 indices of NGC 3201 in Fig. 4 and compare them with those from NGC 362, which has a similar metallicity, in Fig. A.2. Stars from NGC 362 are systematically weaker in CH (Δ = 0.1 mag), with a similar CN. This is basically the difference between pec and S1-1G stars in NGC 3201. We added the peculiar stars of NGC 3201 to the plot of NGC 362 in Fig. A.2 after correcting the magnitudes by the distance modulus difference of 0.63 mag (Harris 1996, 2010 edition), for a better visualization. In fact, the peculiar stars are in good agreement with 1G stars of NGC 362; they are CN-weak and CH-strong. Therefore, the Milky Way has a GC with 1G stars matching the metallicities and CN–CH contents of pec stars in NGC 3201. Should this scenario of merger be true, there is already a pair of real clusters as constraints for the models. As a result, CN–CH is useful to find potential mergers. For Na–O anti-correlation the differences between clusters are less noticeable (Carretta et al. 2009) and Fig. 4 confirms that peculiar, S1, and S2 stars all follow similar trends of Na–O.
Anotherpoint of view is that there are only 1G peculiar stars and not 2G stars, that are typical signatures of GCs. Globular cluster 2G stars are more abundant than 1G stars, so if they were present in the peculiar group, we should have detected them. This characteristic is typical in field stars, that are all 1G stars. In conclusion, we may be looking for an early GC-GC merging of one typical GC with another with only first generation stars, both with the same metallicity or the merging of the progenitor of NGC 3201 with the building blocks of the Milky Way halo (in a single metallicity environment) that almost exclusively presents 1G stars (e.g. Fernández-Trincado et al. 2016). If this scenario is correct, some questions still need to be answered. What is the probability of a merger of two globular clusters with similar metallicity? Is a merger enough to produce a retrograde orbit? Was NGC 3201 formed in the nucleus of a dwarf galaxy? If so, why do we not detect a stellar stream or halo in such an empty region of the sky?
6 Summary and conclusions
We have obtained low-resolution spectra of RGB stars in the GC NGC 3201, derived CN and CH indices, and characterised its multiple stellar generations. Three groups were found in the CN–CH relation for the first time for NGC 3201: the main sequence S1, a secondary less-populated sequence S2, and a peculiar group pec with only CN-weak and CH-weak stars. The three groups are separated by 0.1 mag in CH, which is at 7σ distance. Although the stars are located around the RGB bump or above, no differences were found in the sequences due to extra mixing, possibly because NGC 3201 is relatively metal-poor and the convective cell does not reach the H-burning shell to mix up the CNO-cycle processed material.
Photometric indices were calculated from publicly available catalogues from observations with ground-based and space-based telescopes to find one that splits the groups pec-S1-S2. The key is the use of UV filters that are sensitive to light chemical elements. The index δcU,B,I was only able to separate 1G from 2G stars. The V-δcF275W,F336W,F438W diagram revealed that S1 stars are well split into 1G and 2G along the RGB, and that the smooth transition between the two arms of the RGB have S2 and pec. stars, which could explain why this cluster does not show a totally bifurcated RGB. The δCN-δcF275W,F336W,F438W correlation was useful to find peculiar stars, and the chromosome map δcF275W,I-δcF275W,F336W,F438W separates 1G and 2G stars well only for S1, while S2 and pec stars are concentrated. Probably the most interesting index is δcB,V,I that was able to split the groups in this increasing sequence pec-S1-S2. Although s-process elements do not directly affect broad-band magnitudes, for the case of NGC 5286 this index splits s-Fe-rich from s-Fe-poor stars very well. These groups might also correlate with differences in C+N+O, like other anomalous clusters. In fact, it was shown that anomalous clusters have a correlation in CN–CH with increasing abundances of Fe, C+N+O, and s-process elements. High-resolution spectroscopic analysis is needed to confirm this finding for NGC 3201.
Kernel density estimation of CN indices of NGC 3201 stars were compared to other clusters. We note that the distributions are sensitive to the sample size, uncertainties, and definition of the index, therefore the evidence found in this analysis is mild. We conclude that anomalous GCs like M 22 and NGC 1851 show a quadrimodal CN distribution while typical Milky Way GCs, like NGC 288 and NGC 362, reveal a bimodal CN distribution. We uncover a quadrimodal CN distribution for NGC 3201, resembling that of anomalous clusters.
NGC 3201 cannot be classified as a typical Milky Way GC, but its inclusion in the anomalous group needs confirmation by high-resolution spectroscopic analysis. So far, all anomalou clusters present star-to-star variation of Fe, C+N+O, and s-process elements, where each group has its own anti-correlations of p-capture elements (Na–O, CN–CH), whenever these abundances are available. NGC 3201 is an exceptional case with multiple sequences of CN–CH that seems to correlate with C+N+O and s-process-element abundances, but with no Fe-spread (or at least debatable as in the case of M 22).
A possible scenario for the origin of anomalous clusters is in the nucleus of dwarf galaxies. Anomalous GCs seem to follow a trend on themass-size relation. Some models have shown how larger galaxies may evolve to ultra compact dwarfs and how dwarf galaxies canevolve to globular clusters. NGC 6752 illustrates that not all clusters in this trend are anomalous. NGC 3201 does not follow this trend. If the locus of an anomalous cluster is only in this trend of mass-size, either the scenarioneeds revision to incorporate NGC 3201, or NGC 3201 is not anomalous but a rather abnormal cluster.
Four peculiar stars were discovered presenting CN-weak and CH-weak indices. One of such stars was already indicated by Smith & Norris (1982) and Da Costa et al. (1981). The nature and origin of this group of stars needs further study with high-resolution spectroscopy and detailed chemical abundance analysis. Our proposal scenario to explain these stars is that they were accreted to NGC 3201 during a GC-GC merger, where one of them had only 1G stars, or because NGC 3201 was born in the nucleus of a dwarf galaxy and accreted 1G field stars. All stars should have the same metallicity and similar distribution of CN indices, but with a systematic difference in CH indices.
We compared NGC 3201 with NGC 6752 that has similar mass and metallicity. The latter follows the mass-size relation of anomalous clusters but it has its complexities in the horizontal branch (HB) driven by He abundances. The difference in HB morphology can be explained by the age difference of 1 Gyr. Despite the similarities in global parameters, NGC 6752 does not show complexities similar to the anomalous GCs. In other words, a combination of mass, size, metallicity, age, and nucleosynthesis does not mean that a GC is anomalous. The origin of the anomalies of NGC 3201 and anomalous GCs seems to be external.
Finally, we envisage three possibilities for NGC 3201:
CN–CH pec-S1-S2 is an increasing sequence of C+N+O and s-process-element abundances, which means that NGC 3201 would be the first anomalous GC out of the mass-size relation.
pec-S1-S2 have the same contents of C+N+O and s-process-element abundances, which means that NGC 3201 would be the first non-anomalous GC with multiple CN–CH anti-correlation.
pec-S1-S2 have the same contents of C+N+O and s-process-element abundances, and NGC 3201 would be the first anomalous GC without star-to-star C+N+O and s-process-element abundances.
In all cases, the definition of anomalous clusters and the scenario in which they have an extragalactic origin must be revised.
Acknowledgements
This work was only possible because of ESO approval for the ESO/NEON Observing School at La Silla on February 2016. The authors acknowledge M. Dennefeld and F. Selman for leading the organisation of the school. JPNC thanks E. Pancino for the discussion on the error estimation. The authors are thankful to Prof. G. Da Costa for a careful reading and comments on the manuscript, and also to the anonymous referee for useful suggestions that helped improve the paper.
Appendix A Scaling indices from the literature
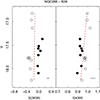 |
Fig. A.1 Similar to Fig. 4 but for NGC 288 with parameters from Kayser et al. (2008). Linear fit because bright stars are only CN-weak. Filled circles are CN-strong, and empty circles are CN-weak stars. Average error bars are displayed in the bottom right corner of each panel. |
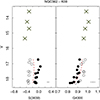 |
Fig. A.2 Same as Fig. A.1 but for NGC 362. Green crosses are the peculiar stars of NGC 3201 for discussion in Sect. 5.3. Magnitudes of NGC 3201 stars are shifted by 0.63 mag to match the distance modulus of NGC 362. |
A.1 Kayser et al. (2008)
We transformed the indices S(3839) and G4300 and their uncertainties from Kayser et al. (2008) from natural logarithm to common logarithm. Using the new indices we followed the procedure described in Sect. 3.3 to correct the indices from stellar surface temperature and gravity effects. The goal is to put all the results in the same scale to allow direct comparisons between ourresults and those from Kayser et al. (2008).
A.2 Indices defined by Norris & Smith (1981)
In Sect. 4.3 we also use indices following the definition of Norris & Smith (1981). We follow the same procedure as in Fig. 4 to put into the same scale the CN indices of NGC 1851 (Campbell et al. 2012), M 22 (Norris & Freeman 1983), and NGC 3201 (Smith & Norris 1982). See Figs. A.4
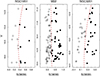 |
Fig. A.4 Similar to Fig. 4 but only for CN of NGC 1851 (Campbell et al. 2012), M 22 (Norris & Freeman 1983), and NGC 3201 (Smith & Norris 1982). Filled circles are CN-strong and empty circles are CN-weak stars. |
Appendix B Errors of the indices
In order to derive the equations for the errors of the indices, we adapted the work realised by Vollmann & Eversberg (2006), who obtained these equations for equivalent widths. The index (I) definition for a general case, taking into account one or n continua regions, is expressed by
 (B.1)
(B.1)
with F(λ) the flux in the band and Fc(λ) the flux in the continuum at the wavelength λ. Then, defining Δλ = λ2 − λ1 and  , and applying the mean value theorem, the expression can be written as
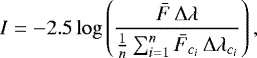 (B.2)
(B.2)
where  and
and  are the arithmetic mean within Δλ and
  of the band and continua fluxes, respectively.
Following the principle of error propagation, as Vollmann & Eversberg (2006) did, we expand the last equation in a Taylor series,
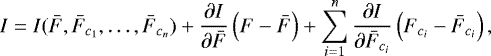 (B.3)
(B.3)
where F and  are random variables. The variance of the expansion is
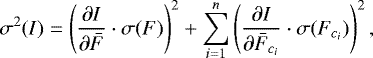 (B.4)
(B.4)
with σ(F) and  the standard deviation in the band and continua, respectively. If we assume a Poisson statistic, the standard deviations are defined by
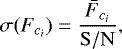 (B.5)
(B.5)
and
 (B.6)
(B.6)
where  is the arithmetic mean of every
  . The partial derivatives, using Eq. (B.2), are
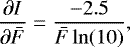 (B.7)
(B.7)
and
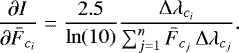 (B.8)
(B.8)
Finally, we can write Eq. (B.4) as
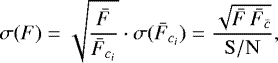
![Mathematical equation: \begin{equation*} \sigma(I)= \frac{2.5}{\ln(10)\, \mathrm{S/N}} \left[ \frac{\bar{F}_{\bar{c}}}{\bar{F}} + \sum^{n}_{i=1} \left( \frac{\bar{F_{c_{i}}}\, {\mathrm{\Delta}}\lambda_{c_{i}}}{\sum^{n}_{j=1} \bar{F_{c_{j}}}\, {\mathrm{\Delta}}\lambda_{c_{j}}} \right)^{2} \right]^{1/2},\end{equation*}](/articles/aa/full_html/2018/06/aa31957-17/aa31957-17-eq23.png) (B.9)
(B.9)
which is the error of an index with n continua regions.
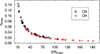 |
Fig. B.1 Errors from Eq. (B.9) as a function of signal-to-noise ratio for CN and CH indices S(3839) and G4300. |
The errors of indices S(3839) and G4300 as a function of signal-to-noise ratio are given in Fig. B.1. This relation is useful to plan observations for other objects estimating the minimum S/N to reach the desired precision. In this work we used only spectra with S/NCN > 25 (i.e. S/NCH > 55) in our analysis.
References
- Bastian, N., & Lardo, C. 2018, ARA&A, in press, [arXiv:1712.01286] [Google Scholar]
- Bekki, K., & Freeman, K. C. 2003, MNRAS, 346, L11 [NASA ADS] [CrossRef] [Google Scholar]
- Bekki, K., & Yong, D. 2012, MNRAS, 419, 2063 [NASA ADS] [CrossRef] [Google Scholar]
- Bragaglia, A., Carretta, E., Gratton, R. G., et al. 2010, ApJ, 720, L41 [NASA ADS] [CrossRef] [Google Scholar]
- Briley, M. M., Hesser, J. E., Bell, R. A., Bolte, M., & Smith, G. H. 1994, AJ, 108, 2183 [NASA ADS] [CrossRef] [Google Scholar]
- Briley, M. M., Harbeck, D., Smith, G. H., & Grebel, E. K. 2004, AJ, 127, 1588 [NASA ADS] [CrossRef] [Google Scholar]
- Campbell, S. W., Yong, D., Wylie-de Boer, E. C., et al. 2012, ApJ, 761, L2 [NASA ADS] [CrossRef] [Google Scholar]
- Carretta, E. 2015, ApJ, 810, 148 [NASA ADS] [CrossRef] [Google Scholar]
- Carretta, E., Gratton, R. G., Lucatello, S., Bragaglia, A., & Bonifacio, P. 2005, A&A, 433, 597 [NASA ADS] [CrossRef] [EDP Sciences] [Google Scholar]
- Carretta, E., Bragaglia, A., Gratton, R. G., et al. 2009, A&A, 505, 117 [NASA ADS] [CrossRef] [EDP Sciences] [Google Scholar]
- Carretta, E., Gratton, R. G., Lucatello, S., et al. 2010, ApJ, 722, L1 [NASA ADS] [CrossRef] [Google Scholar]
- Coelho, P., Barbuy, B., Meléndez, J., Schiavon, R. P., & Castilho, B. V. 2005, A&A, 443, 735 [NASA ADS] [CrossRef] [EDP Sciences] [Google Scholar]
- Cohen, J. G., Briley, M. M., & Stetson, P. B. 2002, AJ, 123, 2525 [NASA ADS] [CrossRef] [Google Scholar]
- Cottrell, P. L., & Da Costa G. S. 1981, ApJ, 245, L79 [NASA ADS] [CrossRef] [Google Scholar]
- Covey, K. R., Wallerstein, G., Gonzalez, G., Vanture, A. D., & Suntzeff, N. B. 2003, PASP, 115, 819 [NASA ADS] [CrossRef] [Google Scholar]
- Da Costa, G. S. 2016, IAU Symp., 317, 110 [Google Scholar]
- Da Costa, G. S., Frogel, J. A., & Cohen, J. G. 1981, ApJ, 248, 612 [NASA ADS] [CrossRef] [Google Scholar]
- Da Costa, G. S., Cannon, R., Croke, B., & Norris, J. 2004, Mem. Soc. Astron. It., 75, 370 [NASA ADS] [Google Scholar]
- Da Costa, G. S., Held, E. V., Saviane, I., & Gullieuszik, M. 2009, ApJ, 705, 1481 [NASA ADS] [CrossRef] [Google Scholar]
- de Mink, S. E., Pols, O. R., Langer, N., & Izzard, R. G. 2009, A&A, 507, L1 [NASA ADS] [CrossRef] [EDP Sciences] [Google Scholar]
- Decressin, T., Meynet, G., Charbonnel, C., Prantzos, N., & Ekström, S. 2007, A&A, 464, 1029 [NASA ADS] [CrossRef] [EDP Sciences] [Google Scholar]
- D’Ercole, A., Vesperini, E., D’Antona, F., McMillan, S. L. W., & Recchi, S. 2008, MNRAS, 391, 825 [NASA ADS] [CrossRef] [Google Scholar]
- Di Cecco, A., Bono, G., Stetson, P. B., et al. 2010, ApJ, 712, 527 [NASA ADS] [CrossRef] [Google Scholar]
- Dias, B., Barbuy, B., Saviane, I., et al. 2016a, A&A, 590, A9 [NASA ADS] [CrossRef] [EDP Sciences] [Google Scholar]
- Dias, B., Saviane, I., Barbuy, B., et al. 2016b, The Messenger, 165, 19 [NASA ADS] [Google Scholar]
- Fernández-Trincado, J. G., Robin, A. C., Moreno, E., et al. 2016, ApJ, 833, 132 [NASA ADS] [CrossRef] [Google Scholar]
- Gonzalez, G., & Wallerstein, G. 1998, AJ, 116, 765 [NASA ADS] [CrossRef] [Google Scholar]
- Gratton, R. G., Sneden, C., Carretta, E., & Bragaglia, A. 2000, A&A, 354, 169 [NASA ADS] [Google Scholar]
- Gratton, R., Sneden, C., & Carretta, E. 2004, ARA&A, 42, 385 [NASA ADS] [CrossRef] [Google Scholar]
- Gratton, R. G., Carretta, E., & Bragaglia, A. 2012, A&ARv., 20, 50 [NASA ADS] [CrossRef] [Google Scholar]
- Gruyters, P., Nordlander, T., & Korn, A. J. 2014, A&A, 567, A72 [NASA ADS] [CrossRef] [EDP Sciences] [Google Scholar]
- Harbeck, D., Smith, G. H., & Grebel, E. K. 2003, AJ, 125, 197 [NASA ADS] [CrossRef] [Google Scholar]
- Harris, W. E. 1996, AJ, 112, 1487 [NASA ADS] [CrossRef] [Google Scholar]
- Kayser, A., Hilker, M., Grebel, E. K., & Willemsen, P. G. 2008, A&A, 486, 437 [NASA ADS] [CrossRef] [EDP Sciences] [Google Scholar]
- Kravtsov, V., Alcaíno, G., Marconi, G., & Alvarado, F. 2009, A&A, 497, 371 [NASA ADS] [CrossRef] [EDP Sciences] [Google Scholar]
- Lardo, C., Milone, A. P., Marino, A. F., et al. 2012, A&A, 541, A141 [NASA ADS] [CrossRef] [EDP Sciences] [Google Scholar]
- Lim, D., Hong, S., & Lee, Y.-W. 2017, ApJ, 844, 14 [NASA ADS] [CrossRef] [Google Scholar]
- Mackey, A. D., & van den Bergh, S. 2005, MNRAS, 360, 631 [NASA ADS] [CrossRef] [Google Scholar]
- Marino, A. F., Villanova, S., Piotto, G., et al. 2008, A&A, 490, 625 [NASA ADS] [CrossRef] [EDP Sciences] [Google Scholar]
- Marino, A. F., Milone, A. P., Piotto, G., et al. 2009, A&A, 505, 1099 [NASA ADS] [CrossRef] [EDP Sciences] [Google Scholar]
- Marino, A. F., Sneden, C., Kraft, R. P., et al. 2011, A&A, 532, A8 [NASA ADS] [CrossRef] [EDP Sciences] [Google Scholar]
- Marino, A. F., Milone, A. P., Karakas, A. I., et al. 2015, MNRAS, 450, 815 [NASA ADS] [CrossRef] [Google Scholar]
- Marino, A. F., Milone, A. P., Yong, D., et al. 2017, ApJ, 843, 66 [NASA ADS] [CrossRef] [Google Scholar]
- Milone, A. P., Marino, A. F., Piotto, G., et al. 2013, ApJ, 767, 120 [NASA ADS] [CrossRef] [Google Scholar]
- Milone, A. P., Piotto, G., Renzini, A., et al. 2017, MNRAS, 464, 3636 [NASA ADS] [CrossRef] [Google Scholar]
- Momany, Y., Piotto, G., Recio-Blanco, A., et al. 2002, ApJ, 576, L65 [NASA ADS] [CrossRef] [Google Scholar]
- Monelli, M., Milone, A. P., Stetson, P. B., et al. 2013, MNRAS, 431, 2126 [NASA ADS] [CrossRef] [Google Scholar]
- Muñoz, C., Geisler, D., & Villanova, S. 2013, MNRAS, 433, 2006 [NASA ADS] [CrossRef] [Google Scholar]
- Mucciarelli, A., Lapenna, E., Massari, D., Ferraro, F. R., & Lanzoni, B. 2015a, ApJ, 801, 69 [NASA ADS] [CrossRef] [Google Scholar]
- Mucciarelli, A., Lapenna, E., Massari, D., et al. 2015b, ApJ, 809, 128 [NASA ADS] [CrossRef] [Google Scholar]
- Nardiello, D., Milone, A. P., Piotto, G., et al. 2015, A&A, 573, A70 [NASA ADS] [CrossRef] [EDP Sciences] [Google Scholar]
- Norris, J. 1987, ApJ, 313, L65 [NASA ADS] [CrossRef] [Google Scholar]
- Norris, J., & Freeman, K. C. 1983, ApJ, 266, 130 [NASA ADS] [CrossRef] [Google Scholar]
- Norris, J., & Smith, G. H. 1981, in IAU Colloq. 68: Astrophysical Parameters for Globular Clusters, eds. A. G. D. Philip, & D. S. Hayes, (Schenectady: Davis Press), 109 [Google Scholar]
- Norris, J., Cottrell, P. L., Freeman, K. C., & Da Costa G. S. 1981, ApJ, 244, 205 [NASA ADS] [CrossRef] [Google Scholar]
- Norris, M. A., Kannappan, S. J., Forbes, D. A., et al. 2014, MNRAS, 443, 1151 [NASA ADS] [CrossRef] [Google Scholar]
- Olszewski, E. W., Saha, A., Knezek, P., et al. 2009, AJ, 138, 1570 [NASA ADS] [CrossRef] [Google Scholar]
- Pancino, E., Rejkuba, M., Zoccali, M., & Carrera, R. 2010, A&A, 524, A44 [NASA ADS] [CrossRef] [EDP Sciences] [Google Scholar]
- Pfeffer, J., & Baumgardt, H. 2013, MNRAS, 433, 1997 [NASA ADS] [CrossRef] [Google Scholar]
- Pickles, A. J. 1985, ApJS, 59, 33 [NASA ADS] [CrossRef] [Google Scholar]
- Piotto, G., Milone, A. P., Bedin, L. R., et al. 2015, AJ, 149, 91 [NASA ADS] [CrossRef] [Google Scholar]
- Prantzos, N., & Charbonnel, C. 2006, A&A, 458, 135 [NASA ADS] [CrossRef] [EDP Sciences] [Google Scholar]
- R Core Team. 2015, R: A Language and Environment for Statistical Computing, R Foundation for Statistical Computing, http://www.R-project.org/. [Google Scholar]
- Renzini, A., D’Antona, F., Cassisi, S., et al. 2015, MNRAS, 454, 4197 [NASA ADS] [CrossRef] [Google Scholar]
- Rey, S.-C., Yoon, S.-J., Lee, Y.-W., Chaboyer, B., & Sarajedini, A. 2001, AJ, 122, 3219 [NASA ADS] [CrossRef] [Google Scholar]
- Riello, M., Cassisi, S., Piotto, G., et al. 2003, A&A, 410, 553 [NASA ADS] [CrossRef] [EDP Sciences] [Google Scholar]
- Robin, A. C., Reylé, C., Derrière, S., & Picaud, S. 2003, A&A, 409, 523 [NASA ADS] [CrossRef] [EDP Sciences] [Google Scholar]
- Salaris, M., Cassisi, S., & Weiss, A. 2002, PASP, 114, 375 [NASA ADS] [CrossRef] [Google Scholar]
- Saviane, I., da Costa, G. S., Held, E. V., et al. 2012, A&A, 540, A27 [NASA ADS] [CrossRef] [EDP Sciences] [Google Scholar]
- Schiavon, R. P., Zamora, O., Carrera, R., et al. 2017, MNRAS, 465, 501 [NASA ADS] [CrossRef] [Google Scholar]
- Simmerer, J., Ivans, I. I., Filler, D., et al. 2013, ApJ, 764, L7 [NASA ADS] [CrossRef] [Google Scholar]
- Smith, G. H. 1983, AJ, 88, 410 [NASA ADS] [CrossRef] [Google Scholar]
- Smith, G. H., & Norris, J. 1982, ApJ, 254, 149 [NASA ADS] [CrossRef] [Google Scholar]
- Smolinski, J. P., Martell, S. L., Beers, T. C., & Lee, Y. S. 2011, AJ, 142, 126 [NASA ADS] [CrossRef] [Google Scholar]
- Snodgrass, C., Saviane, I., Monaco, L., & Sinclaire, P. 2008, The Messenger, 132, 18 [NASA ADS] [Google Scholar]
- Soto, M., Bellini, A., Anderson, J., et al. 2017, AJ, 153, 19 [NASA ADS] [CrossRef] [Google Scholar]
- Stetson, P. B. 1987, PASP, 99, 191 [NASA ADS] [CrossRef] [Google Scholar]
- VandenBerg, D. A., Brogaard, K., Leaman, R., & Casagrande, L. 2013, ApJ, 775, 134 [NASA ADS] [CrossRef] [Google Scholar]
- Vollmann, K., & Eversberg, T. 2006, Astron. Nachr., 327, 862 [NASA ADS] [CrossRef] [Google Scholar]
- von Braun, K., & Mateo, M. 2001, AJ, 121, 1522 [NASA ADS] [CrossRef] [Google Scholar]
- Yong, D., Grundahl, F., & Norris, J. E. 2015, MNRAS, 446, 3319 [NASA ADS] [CrossRef] [Google Scholar]
- Yong, D., Meléndez, J., Grundahl, F., et al. 2013, MNRAS, 434, 3542 [NASA ADS] [CrossRef] [Google Scholar]
For a recent review, see Gratton et al. (2004) and references therein.
R script adapted from http://research.stowers.org/mcm/efg/R/Statistics/MixturesOfDistributions/index.htm.
See also Milone et al. (2017) who classified NGC 362 as type II with a small extra group of 2G stars, difficult to detect here with a sample of 20 stars.
Snapshots of CMDs can be retrieved from here: http://groups.dfa.unipd.it/ESPG/ground.html.
All Tables
All Figures
|
Fig. 1 Colour-magnitude diagram (CMD) of NGC 3201 and selected stars for spectroscopic observations. Panel a: Photometry from pre-images as described in the text. No calibration or de-reddening process was done, except by a zero point offset to match the calibrated CMD from panel b. Targets for spectroscopic observations were selected from this CMD and are shown as orange circles. Panel b: Same as (a) but using photometry from Kravtsov et al. (2009) that is calibrated and corrected by differential reddening. The selected targets are identified and reveal an outlier from the RGB region that should be excluded from our analysis. Moreover, RGB stars are colour-coded. Panel c: Luminosity function of all stars from (b) indicating the over density of the horizontal branch. Panel d: Luminosity function only of RGB stars from (b) indicating the over density of the RGB bump. |
| In the text | |
|
Fig. 2 Heliocentric velocities versus Fe4383 index for all 28 valid spectra. Smoothed histograms show the distribution of the two parameters. We also show the velocities distribution from the Besançon model. Member stars are located in the lower right quadrant indicated by the dashed lines. Sequence 1 (S1), sequence 2 (S2), and peculiar stars (pec.) defined in Fig. 5 are indicated by blue squares, orange diamonds, and green crosses, respectively. CN-strong (δS(3839) ≥ 0) and CN-weak stars (δS(3839) < 0) are represented by filled and open symbols, respectively. These symbols and colours are used also in the following figures. Dashed lines are set by eye at the lower limit of vhelio and the upper limit of Fe4383 distributions. |
| In the text | |
|
Fig. 3 Definition of CN and CH indices S(3839) and G4300 from Eqs. (1) and (2) using spectra of two NGC 3201 stars. Thin lines are from the CN-weak, CH-strong star N3201centre_08, thick lines are from the CN-strong, CH-weak star N3201centre_11, both S1 stars with V ≈ 13 mag. The index region is highlighted by solid blue lines and pseudo-continuum regions are identified by dashed blue lines. Spectra were locally normalised as explained in Sect. 2.2. |
| In the text | |
|
Fig. 4 Correction of S(3839) and G4300 for stellar surface temperature and gravity for 28 member and good quality (S/NCN≥ 25) RGB stars of NGC 3201. We fitted a second-order polynomial to each dataset, which is represented by the red dashed lines. The difference between the indices and the fitted line for a given magnitude defines δS(3839) and δG4300. Symbols arethe same as in Fig. 2. If the peculiar stars indicated by the crosses are not considered, two groups of stars with anti-correlated CN and CH can be identified: S1, indicated by squares, and S2, indicated by diamonds (see also Fig. 5 and discussions). Error bars are of the order of the point size, and are thus omitted in the plots. |
| In the text | |
|
Fig. 5 Panel a: Na–O anti-correlation for all globular clusters from Carretta et al. (2009) in grey dots superimposed by the 11 NGC 3201 stars in common with our sample with available [Na/Fe] and [O/Fe]; symbols are the same as in Fig. 2. Smooth spline function is shown as red dashed line to highlight the anti-correlation in our data. Peculiar stars indicated by green crosses are not considered in the fitted function based on the selection of panel d. Panel b: Correlation between sodium and cyanogen, which is a proxy for nitrogen abundances for the 18 stars in common with available [Na/Fe]. A straight line is fitted to S1 stars. Panel c: Same as (b) but for CH and oxygen for stars in common with available [O/Fe]. The fitted line is shifted by 0.1 mag in δG4300 to match the only S2 star. Panel d: Distribution of CN and CH indices for all 28 NGC 3201 good quality member stars, revealing three groups of stars: sequence 1 (S1), sequence 2 (S2), and peculiar (pec). A second-order polynomial was fitted to S1 stars and the same curve was shifted by 0.1 mag in δG4300 as in panel c to match the S2 stars, and by − 0.1 mag to match the peculiar stars. Mean uncertainties are shown by the cross on the upper right corner of the panel. |
| In the text | |
|
Fig. 6 Spatial distribution of NGC 3201 stars from Kravtsov et al. (2009) in grey dots with a greyscale density pattern. Spectroscopic targets are shown with the same symbols as in Fig. 2 for the 28 good quality member stars. Dashed outer circle shows the half-light radius (rh = 3.1′), the internal dashed red circle is the core radius (rc = 1.3′), and the blue dashed square delimits the region of the HST observations used here. |
| In the text | |
|
Fig. 7 Bottom panel: V −cU,B,I diagram for NGC 3201 using photometry from Kravtsov et al. (2009) corrected by differential reddening but without decontamination from field stars. We selected a rectangle around the RGB stars and fitted a second-order polynomial shown by a dashed red line. This line is used to define δcU,B,I as the difference between cU,B,I and the fitted line for a given V magnitudefor the 28 stars analysed here. Symbols are the same as in Fig. 2. Average error bars are indicated at the upper right corner. Middle panel: correlation between δS(3839) and δcU,B,I for all 28 stars. A linear fit to the S1 stars is shown by a red dashed line. Upper panel: same as middle panel but only for the 14 stars brighter than V < 14 mag. Average error bars are indicated at the upper left corner. |
| In the text | |
|
Fig. 8 Similar to Fig. 7 but using HST UV photometry from Soto et al. (2017), available only for 12 out of the 19 good quality member stars within the HST field of view (See Fig. 6). The bottom panels show the CMDs with our spectroscopic targets identified using the same symbols as in Fig. 2. The index δcF275W,F336W,F438W is plotted against δS(3839) on the upper left panel. A second-order polynomial was fitted to S1 stars, and it is shown as red dashed line. The index δcF275W,F336W,F438W is plotted also against δcF275W,I on the upper right panel, which is a version of the so-called “chromosome map” from Milone et al. (2017) that distinguishes 1G and 2G stars, split by a line inclined by θ = 18°. Our spectroscopic targets are identified on the map. |
| In the text | |
|
Fig. 9 Bottom panel: same as Fig. 7 but for the index cB,V,I defined in Eq. (5). Average error bars are indicated at the upper left corner. Top panels: the KDEs of δcB,V,I are shown for each group of stars: S1, S2, and peculiar only for stars brighter than V < 14. The KDE bandwidth is the average uncertainty of 0.03. Peak values are indicated by vertical dashed lines. |
| In the text | |
|
Fig. 10 KDE of the excess CN-index δS(3839) for NGC 3201 in comparison with two normal Galactic GCs (NGC 288, NGC 362) and one anomalous (M 22), as indicated in the panels. Data for the reference clusters were taken from Kayser et al. (2008) and put in a standard scale. The rug plot indicates the positions of all stars in each panel. The KDE bandwidth is the average uncertainty of each dataset, i.e., σNGC288 = 0.055, σNGC362 = 0.042, σM22 = 0.046, σNGC3201 = 0.031. Multi-Gaussian fitting was performed to each distribution, except pec and S2 stars, as discussed in the text. We also indicate cluster metallicities in the scale of Dias et al. (2016a). |
| In the text | |
|
Fig. 11 Same as Fig. 10 but with S(3839) measured following the classical definition used by Campbell et al. (2012), Norris & Freeman (1983), and Smith & Norris (1982) for a fair comparison with their results on NGC 1851, M 22, and NGC 3201, respectively.The KDE bandwith is the average uncertainty of each dataset, i.e., σNGC1851 = 0.035, σM22 = 0.07, and σNGC3201 = 0.05, respectively. The KDE bandwith for our dataset is 0.031. δS(3839) was calculated for all samples following the same strategy as done in Fig. 4. |
| In the text | |
|
Fig. 12 Mass-size distribution of compact stellar systems with data from Norris et al. (2014). We highlight the nine anomalous GCs listed by Da Costa (2016) and Marino et al. (2015). We also feature NGC 3201 and the massive GC with no dispersion in Fe or s-process elements, NGC 6752. |
| In the text | |
|
Fig. A.1 Similar to Fig. 4 but for NGC 288 with parameters from Kayser et al. (2008). Linear fit because bright stars are only CN-weak. Filled circles are CN-strong, and empty circles are CN-weak stars. Average error bars are displayed in the bottom right corner of each panel. |
| In the text | |
|
Fig. A.2 Same as Fig. A.1 but for NGC 362. Green crosses are the peculiar stars of NGC 3201 for discussion in Sect. 5.3. Magnitudes of NGC 3201 stars are shifted by 0.63 mag to match the distance modulus of NGC 362. |
| In the text | |
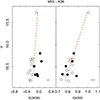 |
Fig. A.3 Same as Fig. A.1 but for M 22. |
| In the text | |
|
Fig. A.4 Similar to Fig. 4 but only for CN of NGC 1851 (Campbell et al. 2012), M 22 (Norris & Freeman 1983), and NGC 3201 (Smith & Norris 1982). Filled circles are CN-strong and empty circles are CN-weak stars. |
| In the text | |
|
Fig. B.1 Errors from Eq. (B.9) as a function of signal-to-noise ratio for CN and CH indices S(3839) and G4300. |
| In the text | |
Current usage metrics show cumulative count of Article Views (full-text article views including HTML views, PDF and ePub downloads, according to the available data) and Abstracts Views on Vision4Press platform.
Data correspond to usage on the plateform after 2015. The current usage metrics is available 48-96 hours after online publication and is updated daily on week days.
Initial download of the metrics may take a while.