Fig. 8
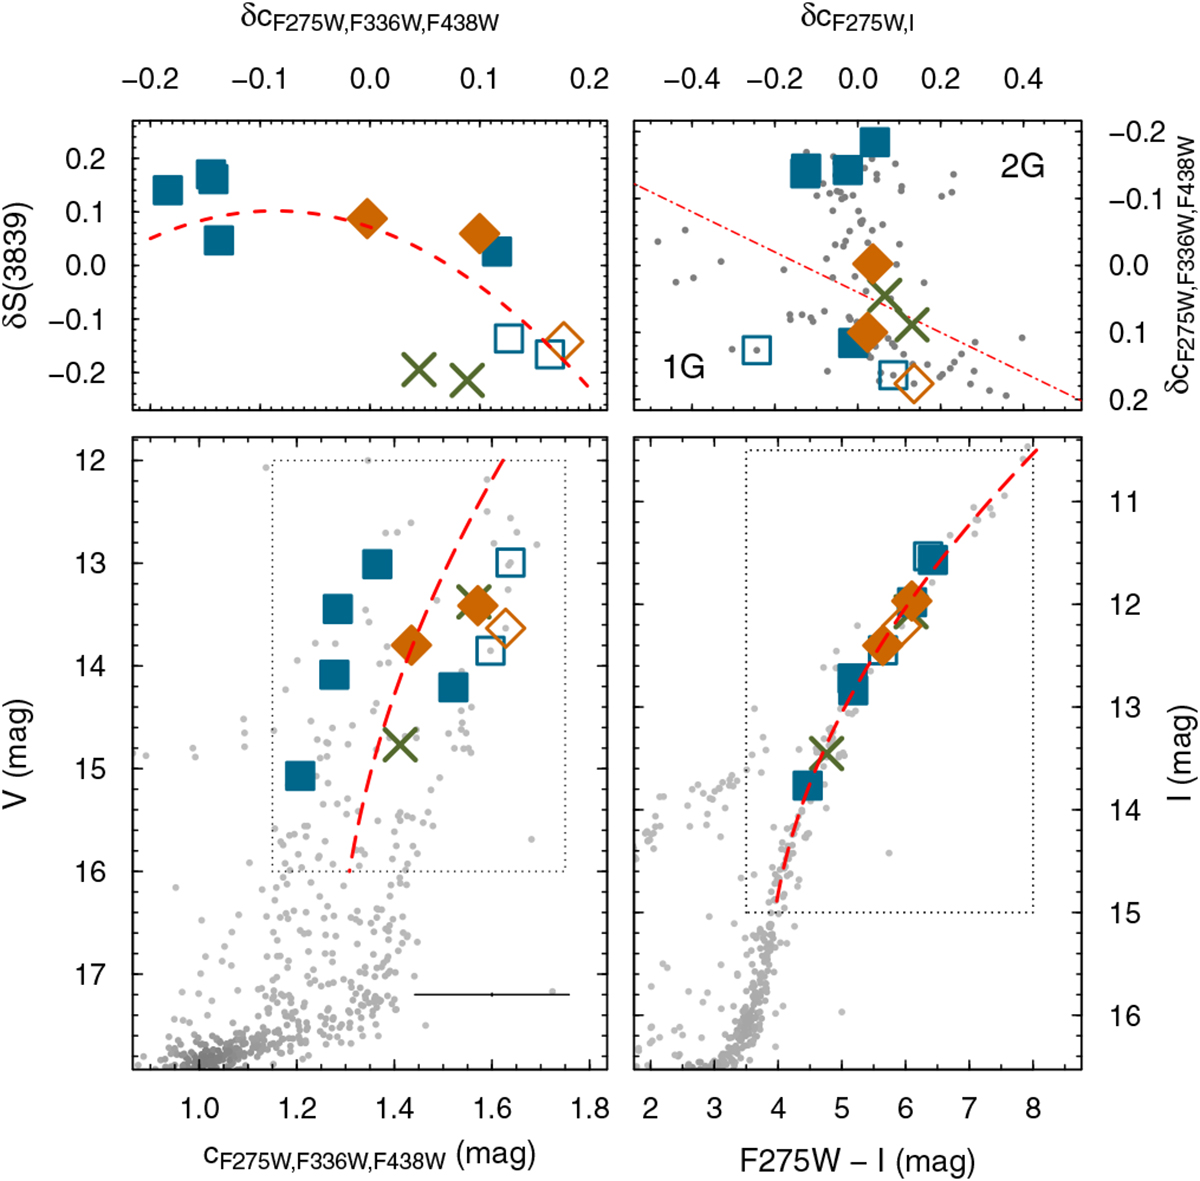
Similar to Fig. 7 but using HST UV photometry from Soto et al. (2017), available only for 12 out of the 19 good quality member stars within the HST field of view (See Fig. 6). The bottom panels show the CMDs with our spectroscopic targets identified using the same symbols as in Fig. 2. The index δcF275W,F336W,F438W is plotted against δS(3839) on the upper left panel. A second-order polynomial was fitted to S1 stars, and it is shown as red dashed line. The index δcF275W,F336W,F438W is plotted also against δcF275W,I on the upper right panel, which is a version of the so-called “chromosome map” from Milone et al. (2017) that distinguishes 1G and 2G stars, split by a line inclined by θ = 18°. Our spectroscopic targets are identified on the map.
Current usage metrics show cumulative count of Article Views (full-text article views including HTML views, PDF and ePub downloads, according to the available data) and Abstracts Views on Vision4Press platform.
Data correspond to usage on the plateform after 2015. The current usage metrics is available 48-96 hours after online publication and is updated daily on week days.
Initial download of the metrics may take a while.