Fig. 9
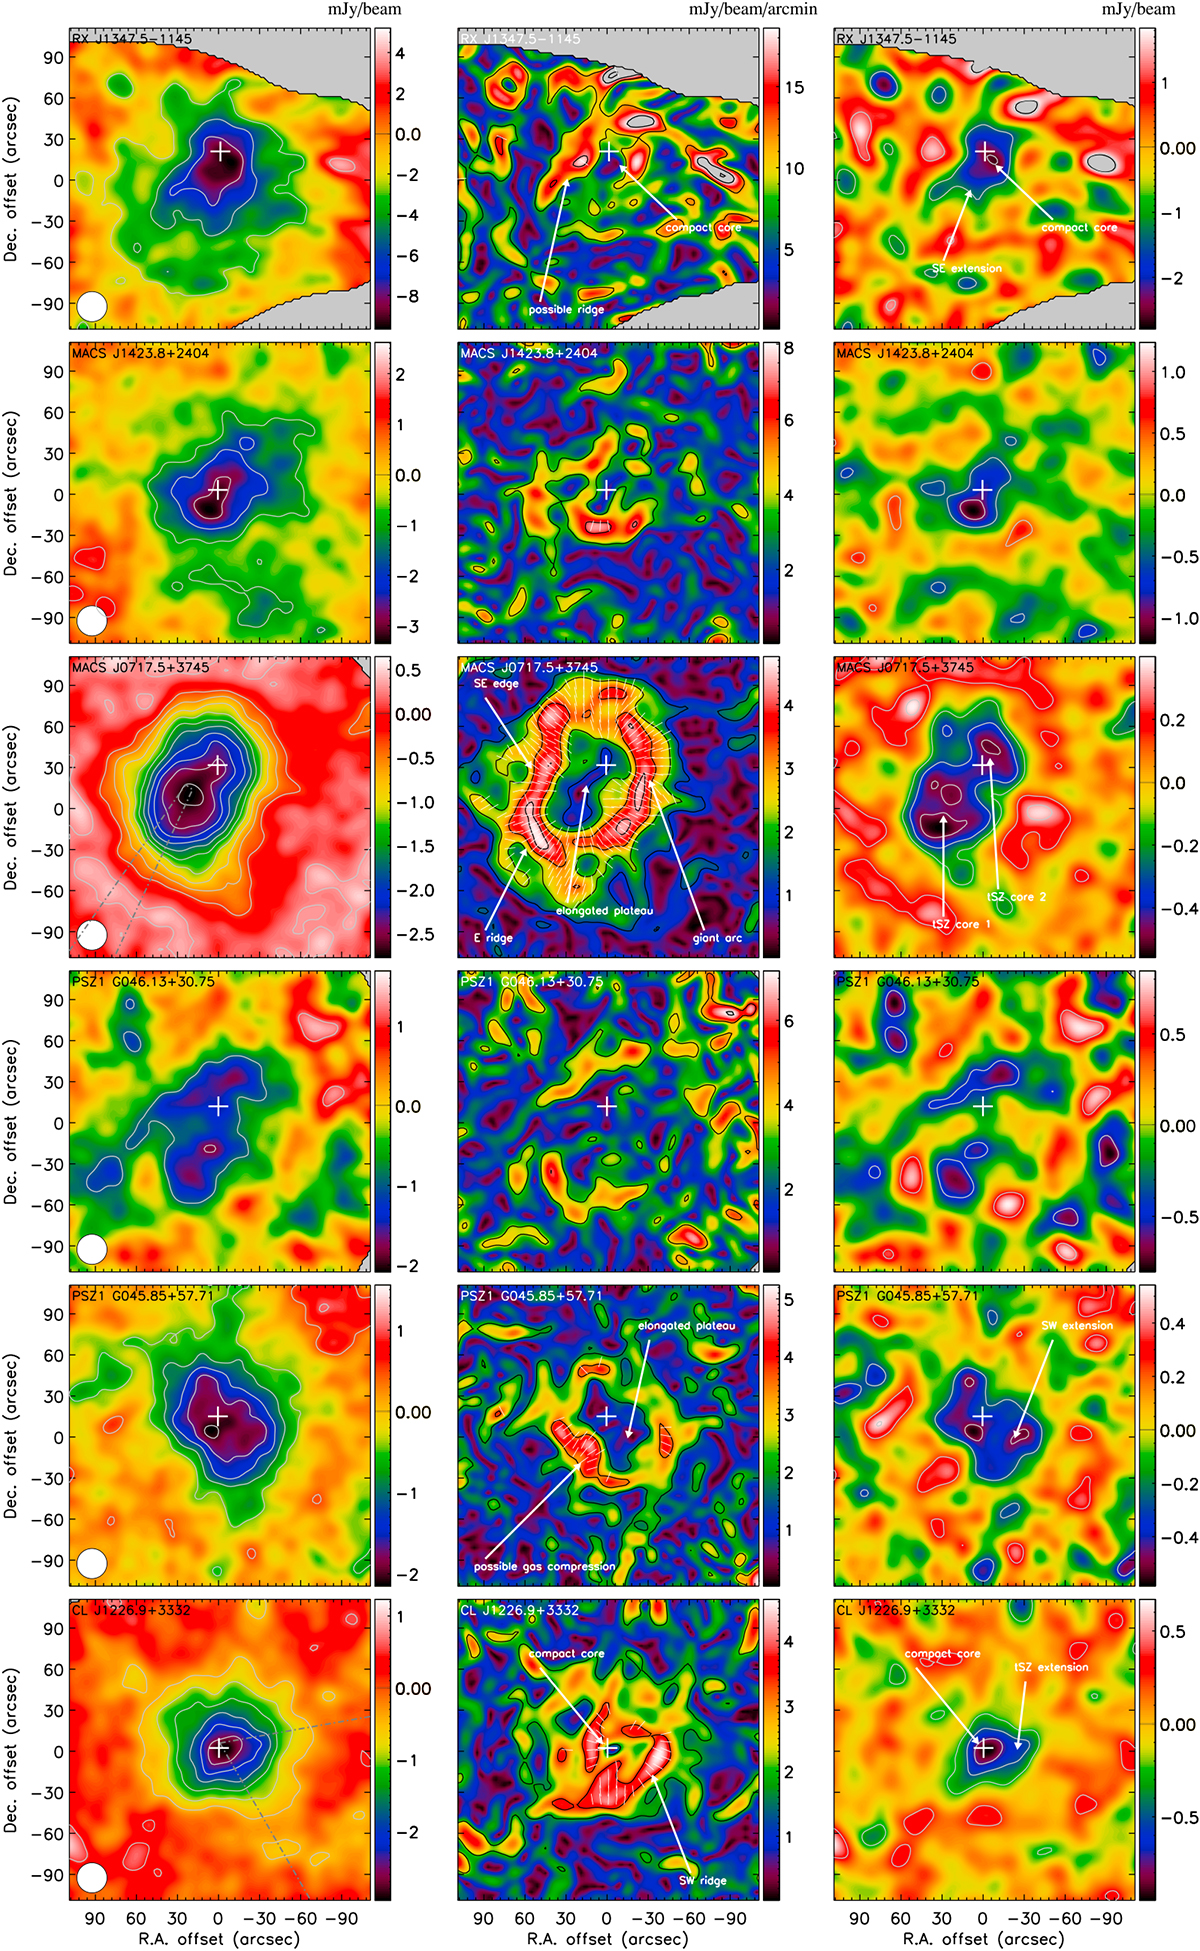
Redshift-ordered maps of the NIKA cluster sample at 150 GHz. Left: surface brightness images. Each map has been smoothed to an effective angular resolution of 22 arcsec FWHM, as shown by the bottom left white circle. Point sources have been subtracted and the data have been deconvolved from the transfer function, but the zero level absolute brightness remains unconstrained. Middle: GGM filtered maps. Right: DoG filtered maps. In all cases, contours provide the S/N, starting at ± 2σ and increasing by 2σ steps. The white crosses provide the main X-ray peak (see Table 3). In the case of MACS J0717.5+3745, the kSZ contribution is not accounted for in the map presented here (see Appendix C and Sect. 6.3 for more details). In the case of CL J1226.9+3332 and MACS J0717.5+3745, the dashed lines correspond to the cone used to define the GGM ridge region when extracting profiles in Figs. 12 and 11.
Current usage metrics show cumulative count of Article Views (full-text article views including HTML views, PDF and ePub downloads, according to the available data) and Abstracts Views on Vision4Press platform.
Data correspond to usage on the plateform after 2015. The current usage metrics is available 48-96 hours after online publication and is updated daily on week days.
Initial download of the metrics may take a while.