Free Access
Fig. 7
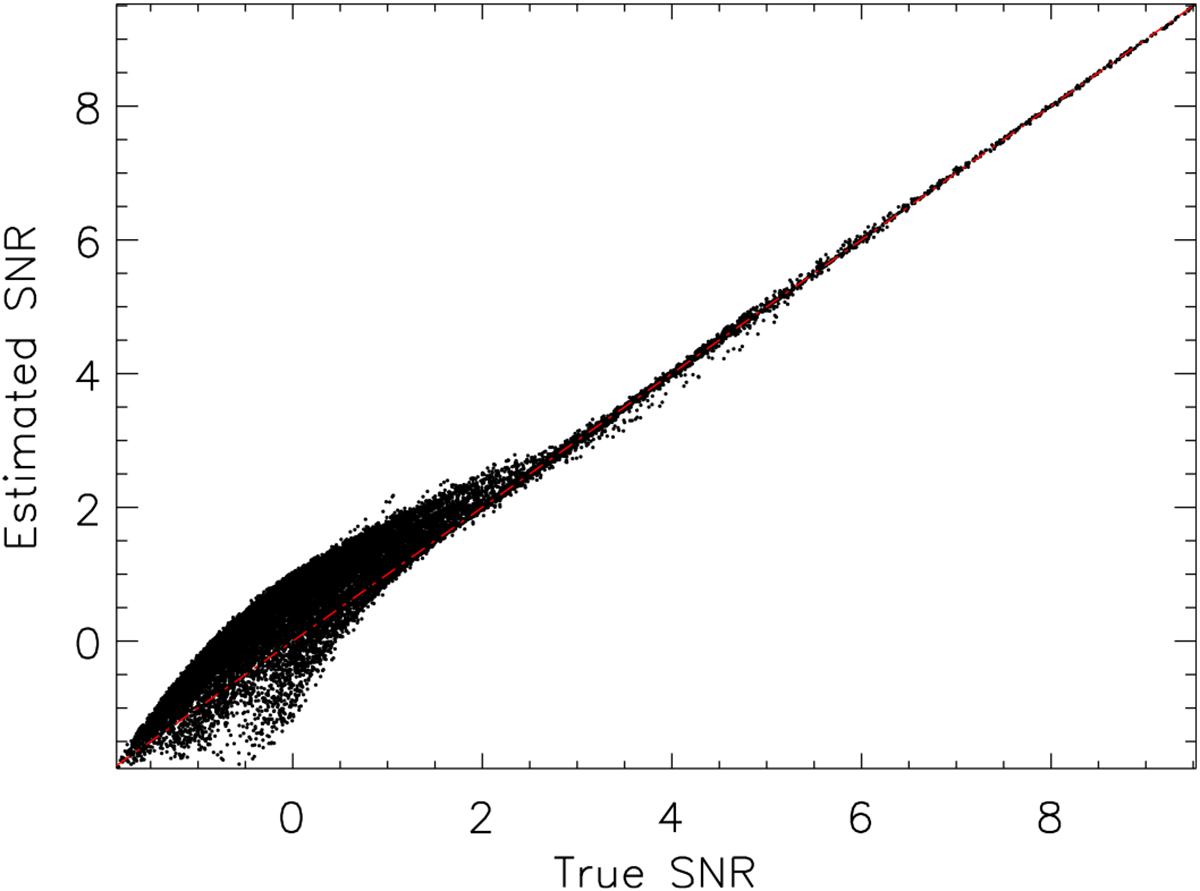
Comparison of the estimated GGM filtered maps S/N as a function of the true S/N, using the RHAPSODY-G sub-sample. The estimated S/N is computed using the NIKA processed RHAPSODY-G sub-sample (Eq. (9)). The red dashed line represent the one to one correspondence. Each point corresponds to a pixel of the map.
Current usage metrics show cumulative count of Article Views (full-text article views including HTML views, PDF and ePub downloads, according to the available data) and Abstracts Views on Vision4Press platform.
Data correspond to usage on the plateform after 2015. The current usage metrics is available 48-96 hours after online publication and is updated daily on week days.
Initial download of the metrics may take a while.