Fig. 6
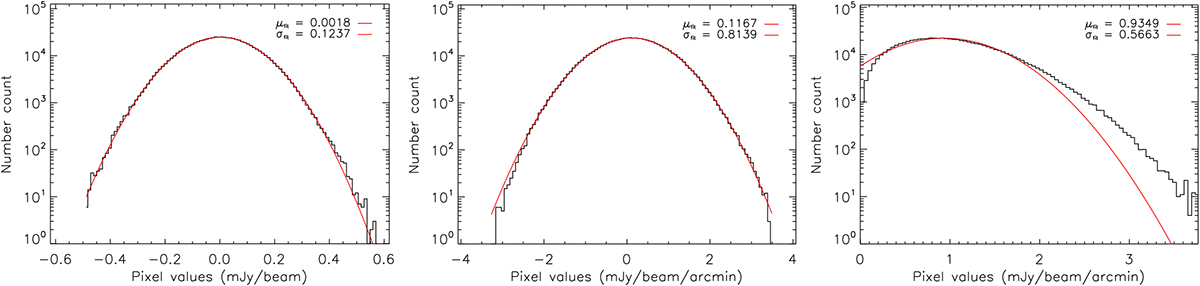
Noise distribution of all the pixels enclosed within 30 arcsec radius from the cluster center, in the case of CL J1226.9+3332, for our baseline filter parameters. The red curves provide the best Gaussian fit to the histograms. Left: DoG noise histogram. Middle: GGM noise histogram in the case of Ŝ set to the observed signal of CL J1226.9+3332. Right: GGM noise histogram in the case where Ŝ = 0 in Eq (8).
Current usage metrics show cumulative count of Article Views (full-text article views including HTML views, PDF and ePub downloads, according to the available data) and Abstracts Views on Vision4Press platform.
Data correspond to usage on the plateform after 2015. The current usage metrics is available 48-96 hours after online publication and is updated daily on week days.
Initial download of the metrics may take a while.