Fig. 5
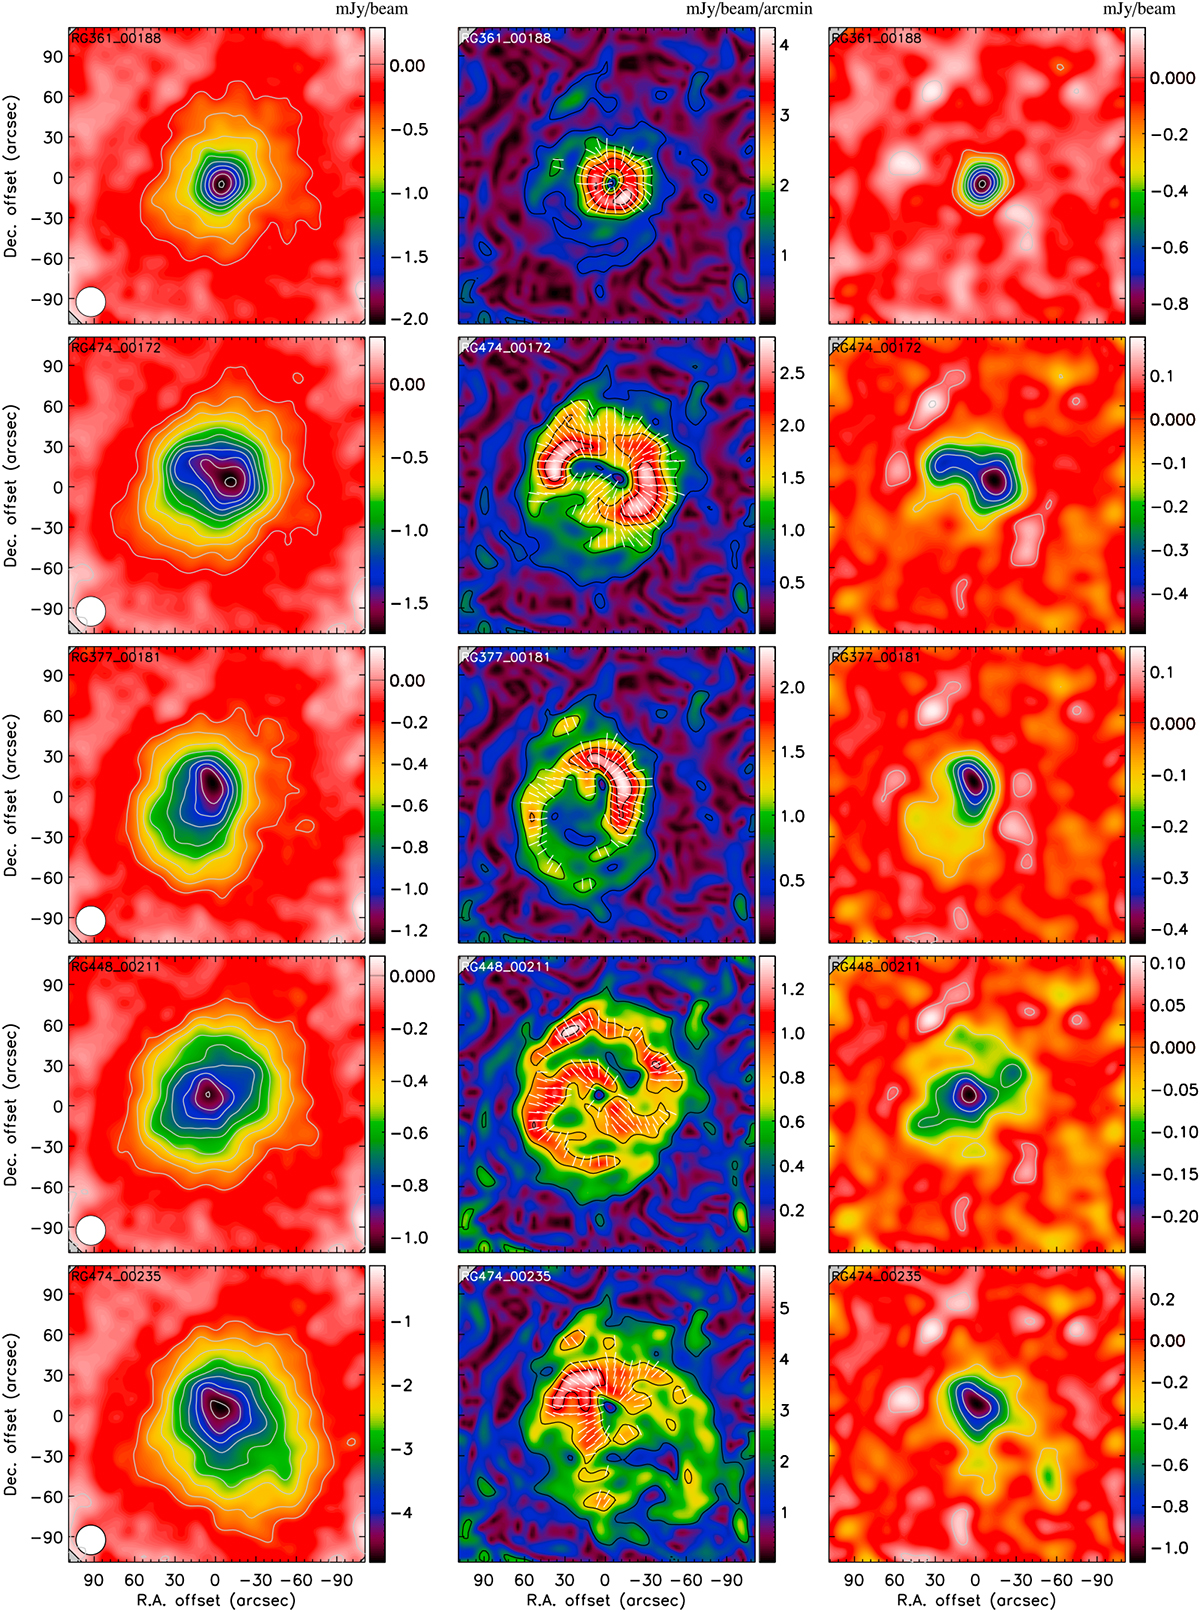
As in Fig. 4 but for the case of end-to-end processing of the simulated RHAPSODY-G sub-sample: surface brightness maps (left), GGM filtered maps (middle) and DoG filtered maps (right). From top to bottom, the clusters areRG361_00188, RG474_00172, RG377_00181 and RG448_00211 (see also Table 2 for the main properties of the sample). The surface brightness images are deconvolved from the transfer function (but not from the beam smoothing) and the S/N contours are estimated as in the case of real data (separated by steps of 2σ).
Current usage metrics show cumulative count of Article Views (full-text article views including HTML views, PDF and ePub downloads, according to the available data) and Abstracts Views on Vision4Press platform.
Data correspond to usage on the plateform after 2015. The current usage metrics is available 48-96 hours after online publication and is updated daily on week days.
Initial download of the metrics may take a while.