Fig. 4
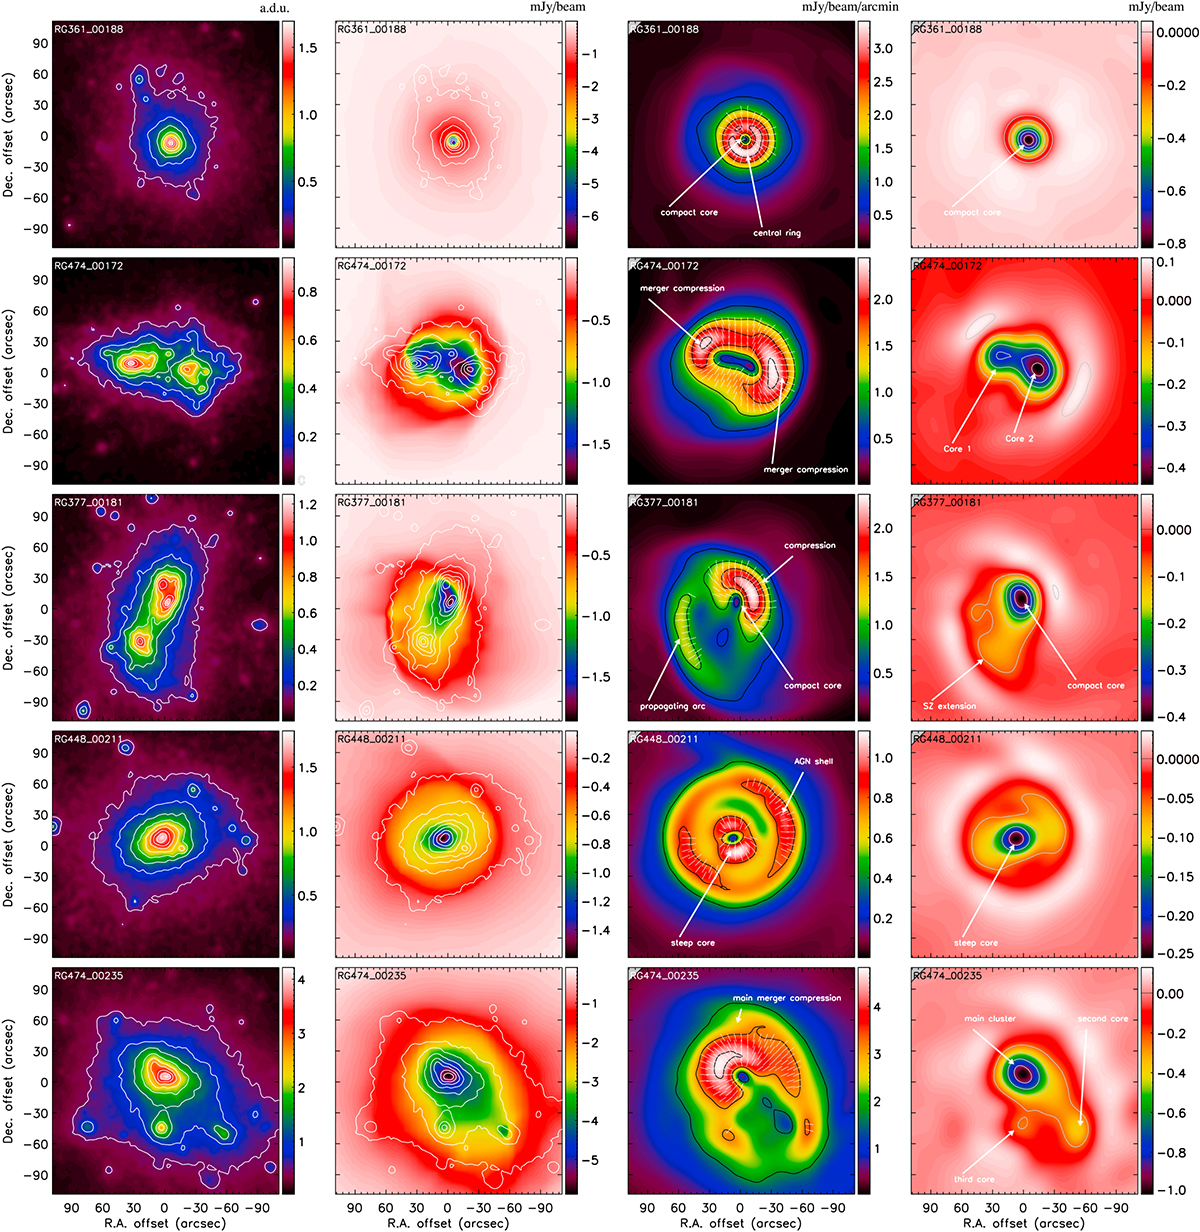
Application of the filtering algorithms to clusters from the RHAPSODY-G suite of simulations. From top to bottom, the clusters are RG361_00188, RG474_00172, RG377_00181, RG448_00211, and RG474_00235 (see also Table 2 for the main properties of the sample). Left: projected dark matter density. Contours are linearly spaced. Units are arbitrary. Middle left: input raw tSZ surface brightness maps with dark matter map contours overlaid. Units are mJy beam−1. Middle right: GGM filtered maps with θ0 = 15′′. The white vectors represent the direction of the gradient, Ψ. Units are mJy beam−1 arcmin−1. Right: DoG filtered maps with θ1 = 15′′ and θ2 = 45′′. Units are mJy beam−1. The contours provide the true S/N expected for the simulation of the observation of these sources done in Sect. 5. They are given by steps of 2σ excluding 0 (see Sect. 5 for further discussions about the S/N estimates).
Current usage metrics show cumulative count of Article Views (full-text article views including HTML views, PDF and ePub downloads, according to the available data) and Abstracts Views on Vision4Press platform.
Data correspond to usage on the plateform after 2015. The current usage metrics is available 48-96 hours after online publication and is updated daily on week days.
Initial download of the metrics may take a while.