Fig. 2
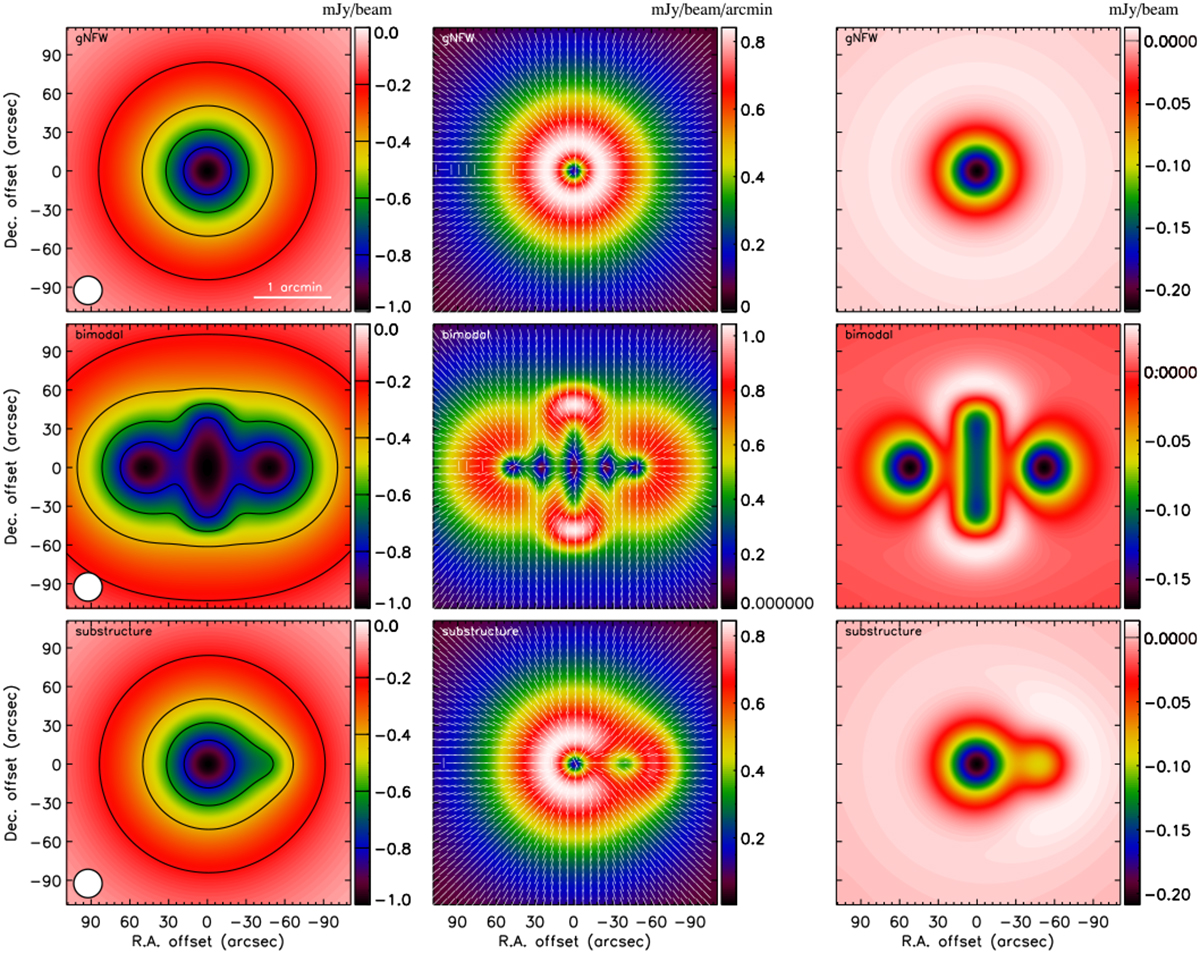
Surface brightness and GGM and DoG response to the tSZ signal expected for a spherically symmetric gNFW pressure profile (top), a bimodal cluster plus a pressure bar (middle), and a main core plus an extension (bottom). Left: tSZ simulated surface brightness. The white circle on the bottom left provides the beam FWHM. Middle: GGM filtered maps with θ0 = 15′′. The white vectors represent the direction of the gradient, Ψ. Right: DoG filtered maps with θ1 = 15′′ and θ2 = 45′′.
Current usage metrics show cumulative count of Article Views (full-text article views including HTML views, PDF and ePub downloads, according to the available data) and Abstracts Views on Vision4Press platform.
Data correspond to usage on the plateform after 2015. The current usage metrics is available 48-96 hours after online publication and is updated daily on week days.
Initial download of the metrics may take a while.