Fig. B.1
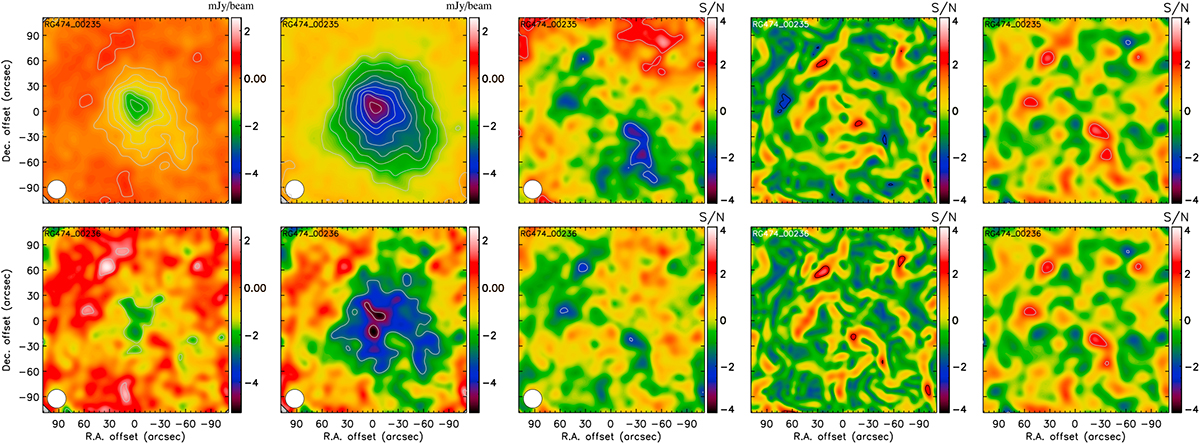
Effect of the deconvolution on the processed map (first two columns) and difference between the expected signal and the recovered signal (3 last columns), in the case of the very massive and nearby test cluster RG474_00235. The top panel correspond to the high S/N case, and the bottom panel to the low signal-to-noise case, with a peak S/N of about 20 and 3, respectively, at the 22 arcsec resolution. From left to right, we provide: the raw processed surface brightness, the deconvolved surface brightness, the deconvolved surface brightness difference map, the GGM difference map, and the DoG difference map. In all cases, contours provide the S/N, starting at ± 2σ and increasing by 2σ steps.
Current usage metrics show cumulative count of Article Views (full-text article views including HTML views, PDF and ePub downloads, according to the available data) and Abstracts Views on Vision4Press platform.
Data correspond to usage on the plateform after 2015. The current usage metrics is available 48-96 hours after online publication and is updated daily on week days.
Initial download of the metrics may take a while.