Fig. 12
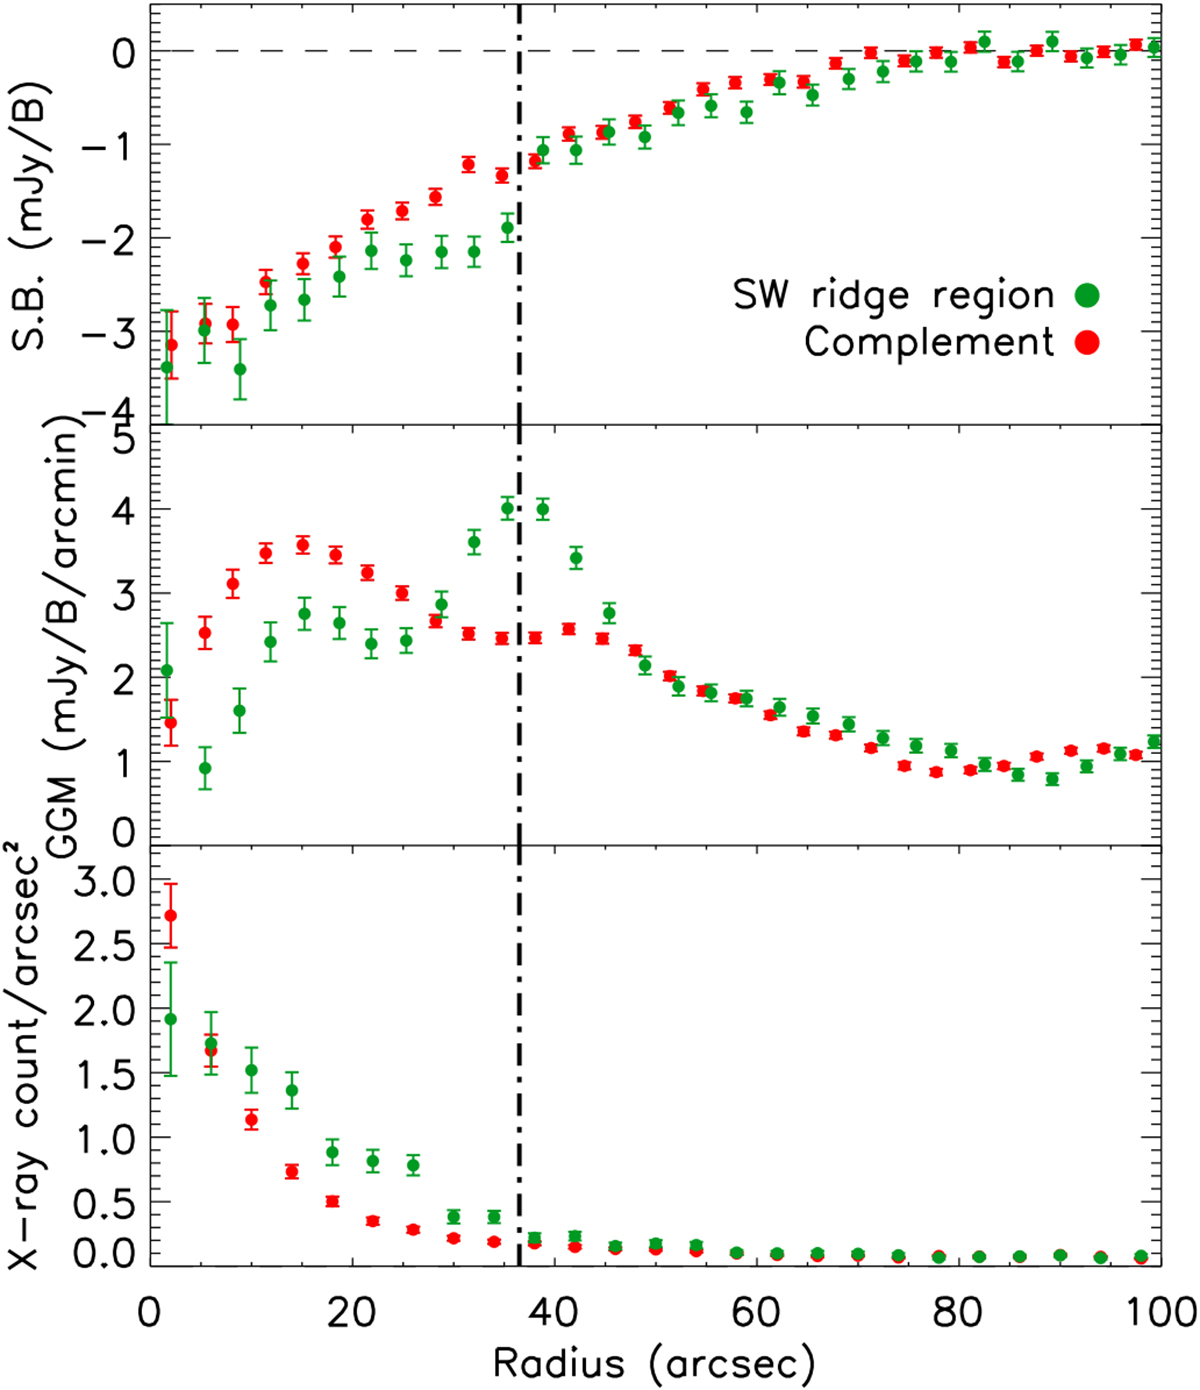
Comparison of the profile of CL J1226.9+3332 in the region of the GGM ridge (green) to its complement (red). The GGM ridge region is define in Fig. 9, as the black dashed line on the surface brightness image. The dashed-dotted line correspond to the GGM ridge location. Top: surface brightness profile. Middle: GGM profile. Bottom: Chandra photon count per unit area profile.
Current usage metrics show cumulative count of Article Views (full-text article views including HTML views, PDF and ePub downloads, according to the available data) and Abstracts Views on Vision4Press platform.
Data correspond to usage on the plateform after 2015. The current usage metrics is available 48-96 hours after online publication and is updated daily on week days.
Initial download of the metrics may take a while.