Fig. 11
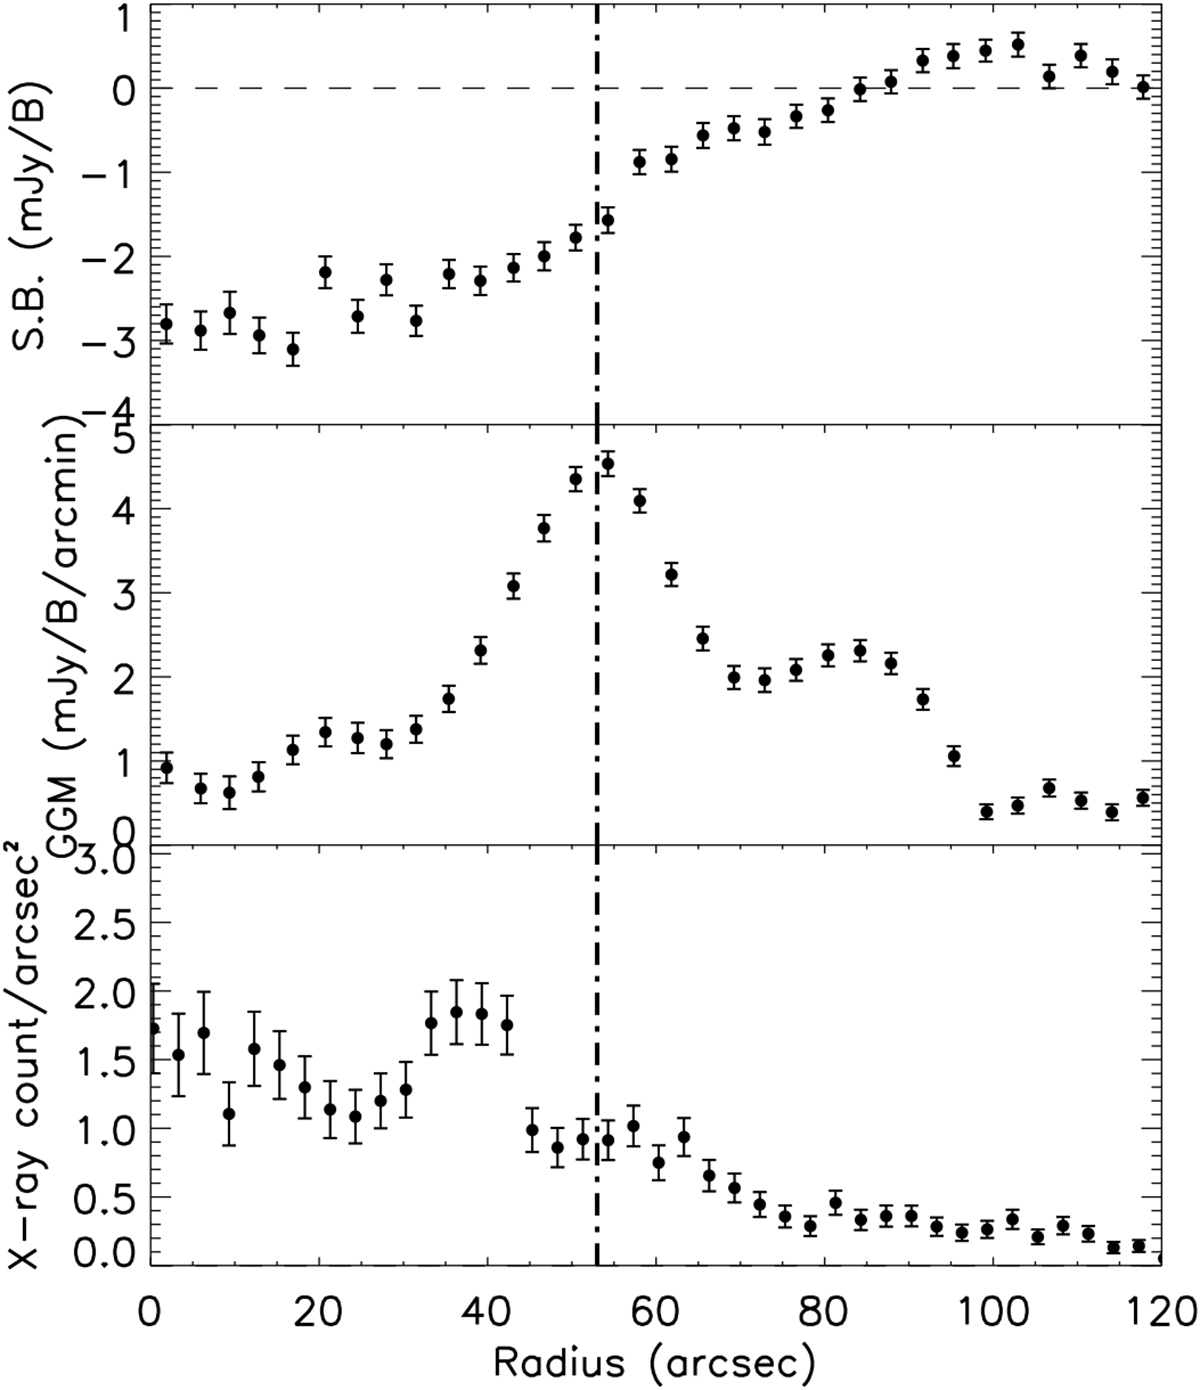
Profile of MACS J0717.5+3745 in the region defined to include the strongest GGM ridge (east ridge, see Fig. 9, as the dark gray dashed line on the surface brightness image). The dashed-dotted line correspond to the GGM ridge location. Top: surface brightness profile. Middle: GGM profile. Bottom: Chandra photon count per unit area profile.
Current usage metrics show cumulative count of Article Views (full-text article views including HTML views, PDF and ePub downloads, according to the available data) and Abstracts Views on Vision4Press platform.
Data correspond to usage on the plateform after 2015. The current usage metrics is available 48-96 hours after online publication and is updated daily on week days.
Initial download of the metrics may take a while.