Fig. A.1
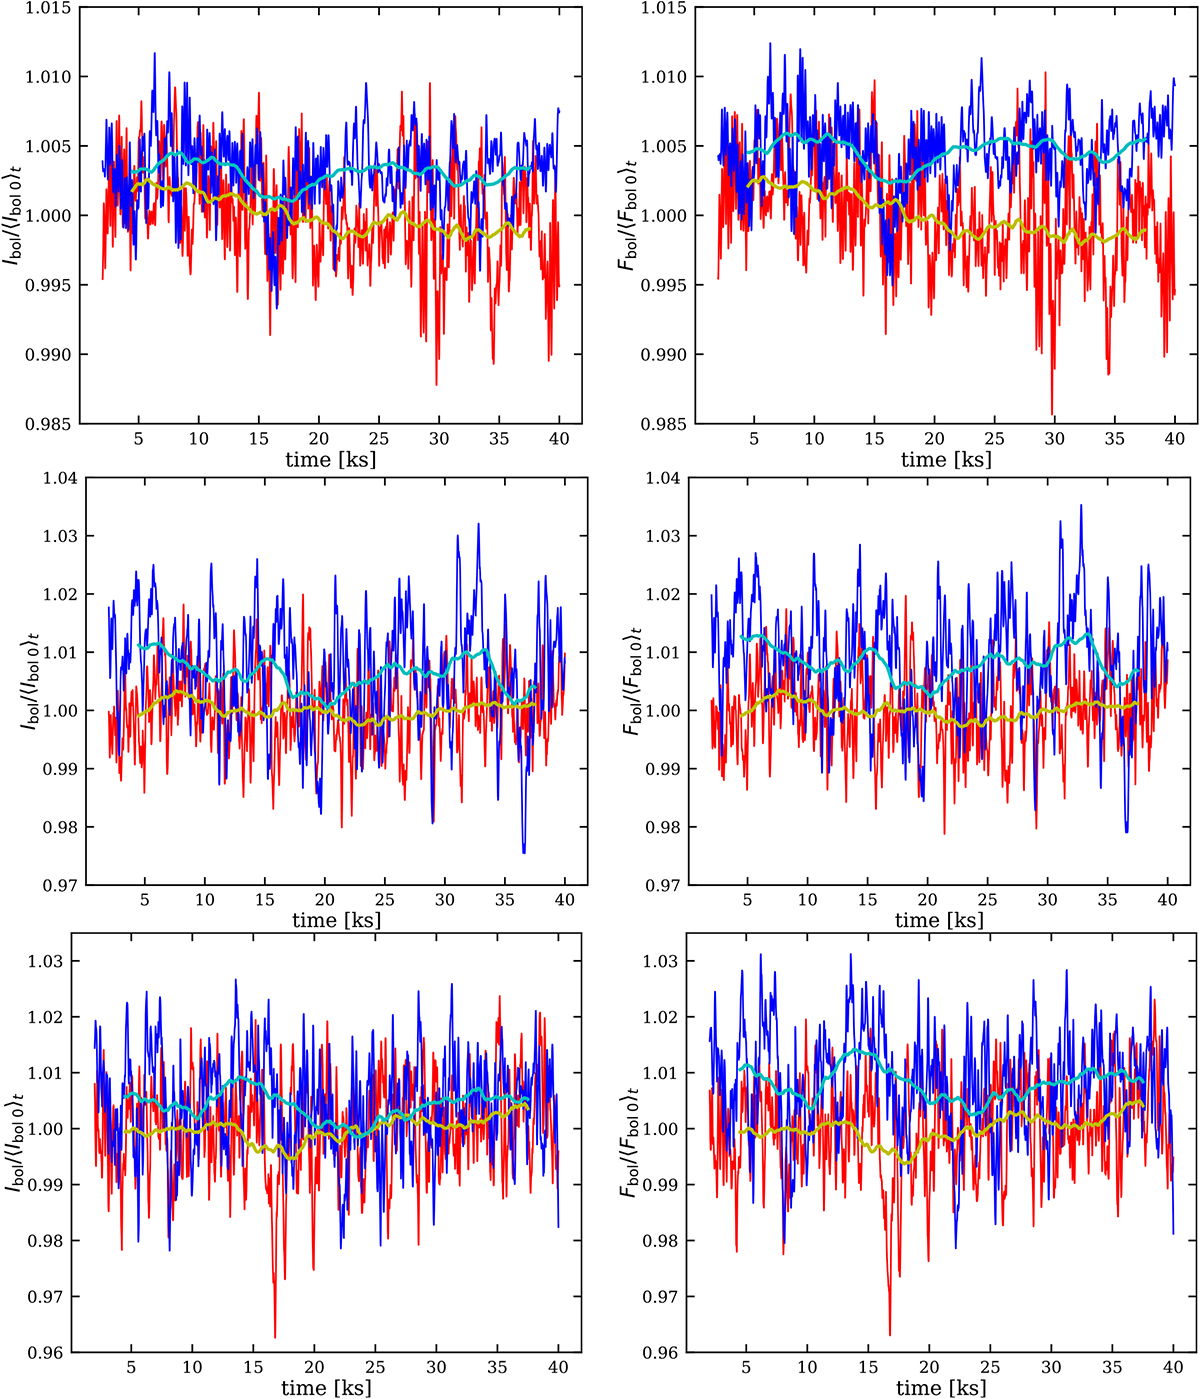
Bolometric radiative intensity (left) and bolometric radiative flux (right) leaving the computational domain in the vertical direction through the top boundary as a function of time for both the magnetic (blue curve) and the non-magnetic (red curve) models. From top to bottom: models K8V, K2V, and F5V. The cyan and orange curves are the moving (box car) average of the magnetic and non-magnetic model, respectively, with a time window width of 5000 s.
Current usage metrics show cumulative count of Article Views (full-text article views including HTML views, PDF and ePub downloads, according to the available data) and Abstracts Views on Vision4Press platform.
Data correspond to usage on the plateform after 2015. The current usage metrics is available 48-96 hours after online publication and is updated daily on week days.
Initial download of the metrics may take a while.