Fig. 6
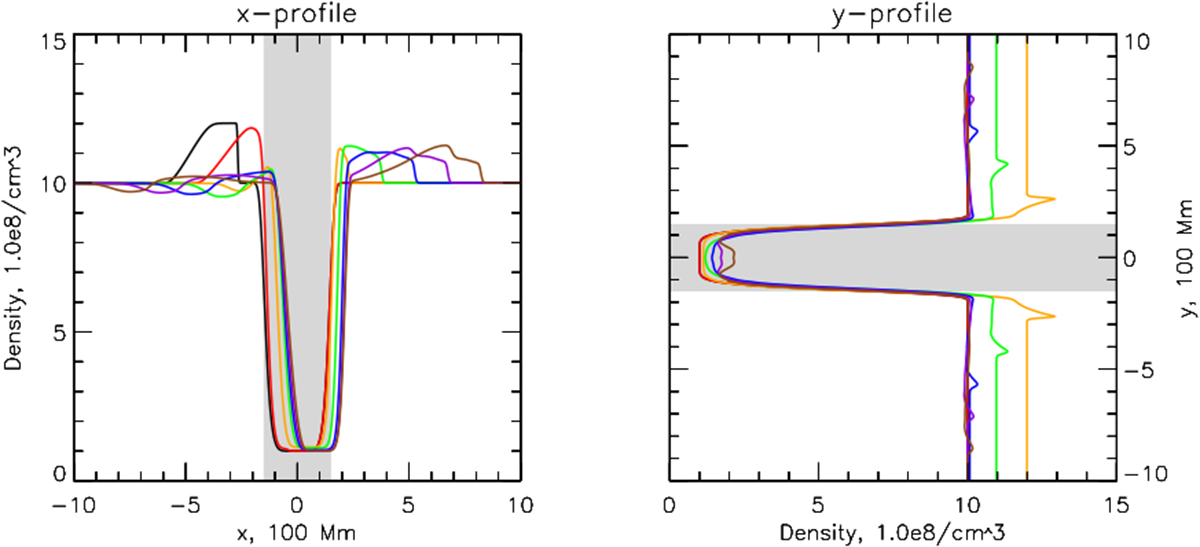
Density profiles at y = 0 (left) and x = 0 (right) for different simulation times in the case of wave interaction with the coronal hole. Black, red, orange, green, blue, violet, and brown colours correspond to t = 4.1, 5.0, 5.9, 6.8, 7.7, 8.6, 9.5, respectively. The grey shading shows the initial position of the plasma non-uniformity and its size characterised by parameter d.
Current usage metrics show cumulative count of Article Views (full-text article views including HTML views, PDF and ePub downloads, according to the available data) and Abstracts Views on Vision4Press platform.
Data correspond to usage on the plateform after 2015. The current usage metrics is available 48-96 hours after online publication and is updated daily on week days.
Initial download of the metrics may take a while.