Fig. 7
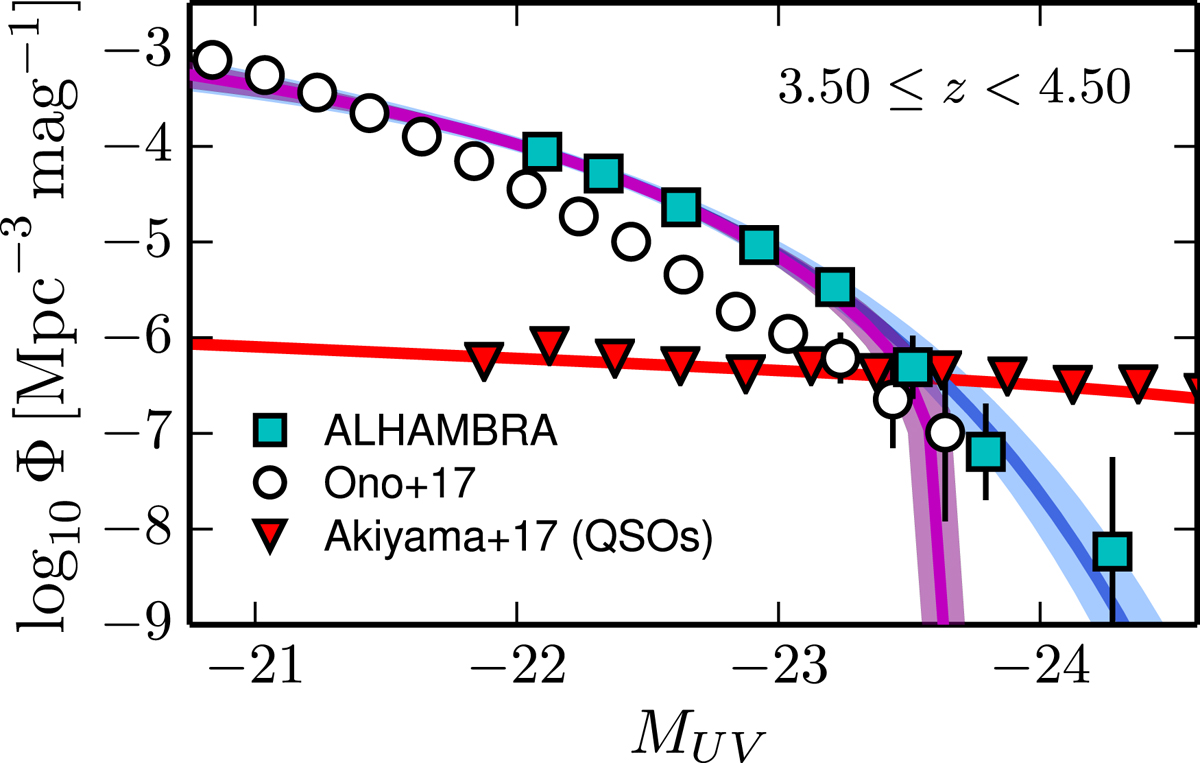
ALHAMBRA UV LF of Fig. 6 at redshift z ~ 4 and the corresponding Schechter fit (blue squares and blue line). The LF from Ono et al. (2018) is shown as white circles. The QSO LF of Akiyama et al. (2018) at z ~ 4 is plotted as red upside-down triangles. The purple line shows the best Schechter fit when this (absolute maximum) QSO contamination is subtracted from our z ~ 4 LF fit.
Current usage metrics show cumulative count of Article Views (full-text article views including HTML views, PDF and ePub downloads, according to the available data) and Abstracts Views on Vision4Press platform.
Data correspond to usage on the plateform after 2015. The current usage metrics is available 48-96 hours after online publication and is updated daily on week days.
Initial download of the metrics may take a while.