Fig. 6
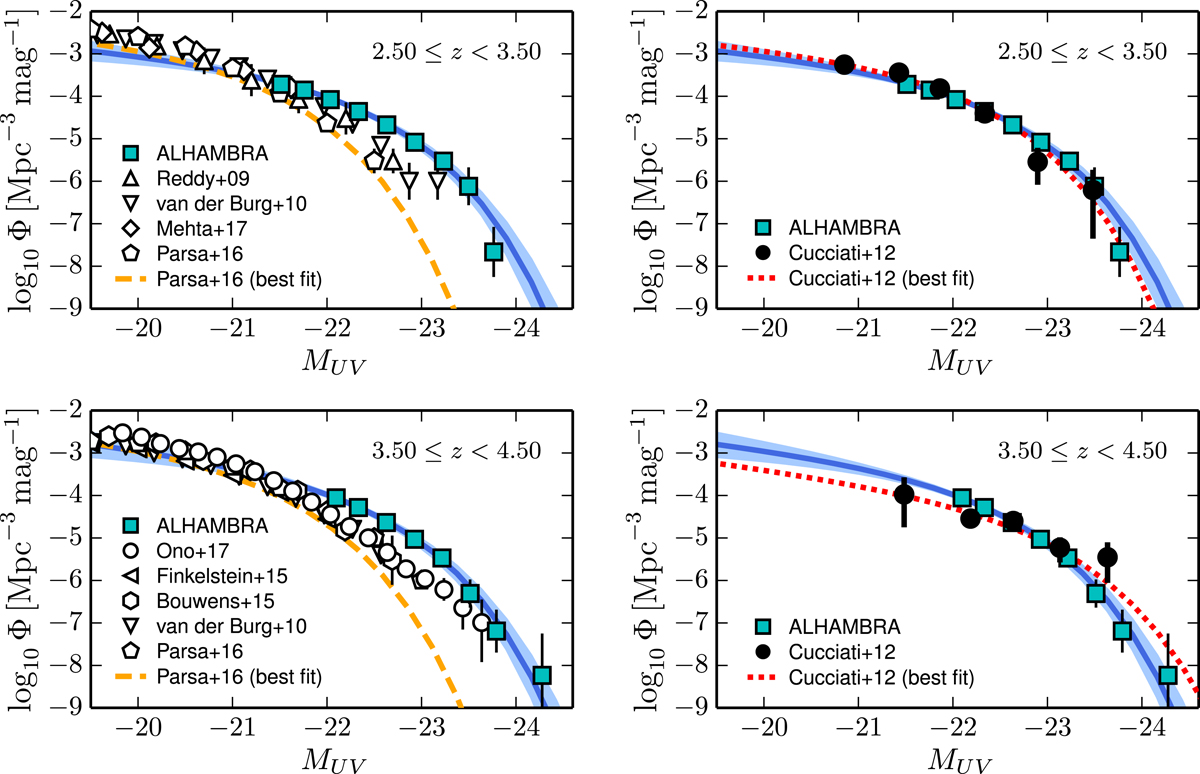
ALHAMBRA UV LF at two redshift bins as indicated in the panels. The ALHAMBRA measurements are shown as blue squares together with their 2-σ error bars, and the blue line shows our best median Schechter fit, shaded area enclosing 95% of the solutions. Left panels: comparison with literature data from photometrically selected samples of high-z galaxies is shown as follows: triangles (Reddy & Steidel 2009), upside-down triangles (van der Burg et al. 2010), diamonds (Mehta et al. 2017), pentagons and orange dashed-line (Parsa et al. 2016), open circles (Ono et al. 2018), left pointing triangles (Finkelstein et al. 2015), and hexagons (Bouwens et al. 2015). Right panels: comparison with the spectroscopic LF estimate of Cucciati et al. (2012) (black dots and red dotted line).
Current usage metrics show cumulative count of Article Views (full-text article views including HTML views, PDF and ePub downloads, according to the available data) and Abstracts Views on Vision4Press platform.
Data correspond to usage on the plateform after 2015. The current usage metrics is available 48-96 hours after online publication and is updated daily on week days.
Initial download of the metrics may take a while.