Fig. 4
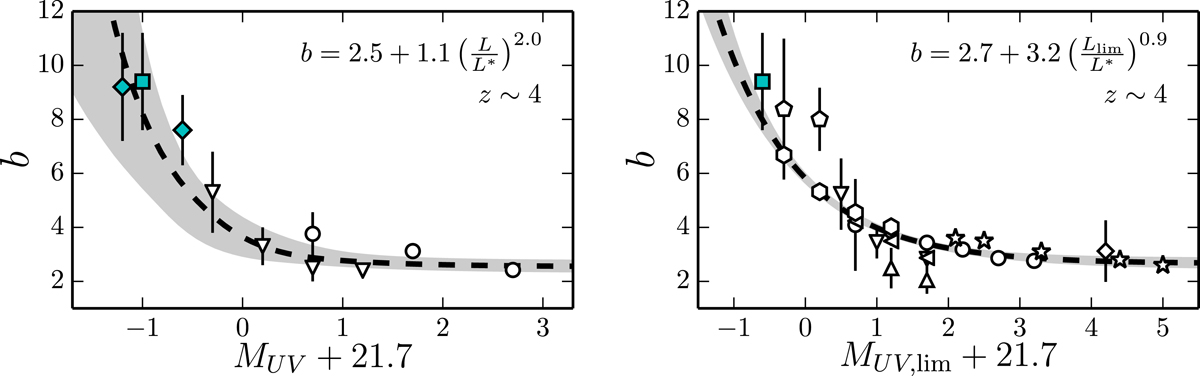
Left: bias values as a function of absolute UV magnitude. The blue filled square represents our data point at z ~ 4 and blue filled diamonds our data points at z ~ 3. The z ~ 3 points are shown as a comparison but are not used in the fit. The data points from Ouchi et al. (2004) and Cooray & Ouchi (2006) are shown as triangles and circles, respectively. Right: bias values as a function of the limiting absolute UV magnitude of each data set. The blue filled square shows our data point at z ~ 4. The results from the literature are shown as circles (Ouchi et al. 2005), pentagons (Allen et al. 2005), triangles (Ouchi et al. 2001), inverted triangles (Ouchi et al. 2004), diamonds (Arnouts et al. 2002), left-pointing triangles (Hildebrandt et al. 2009), stars (Harikane et al. 2016), and hexagons (Harikane et al. 2018). The black dashed line shows our best fit of Eq. (26) as also labelled in the figures. The 1-σ errors are shown as grey shaded areas.
Current usage metrics show cumulative count of Article Views (full-text article views including HTML views, PDF and ePub downloads, according to the available data) and Abstracts Views on Vision4Press platform.
Data correspond to usage on the plateform after 2015. The current usage metrics is available 48-96 hours after online publication and is updated daily on week days.
Initial download of the metrics may take a while.