Free Access
Fig. 2
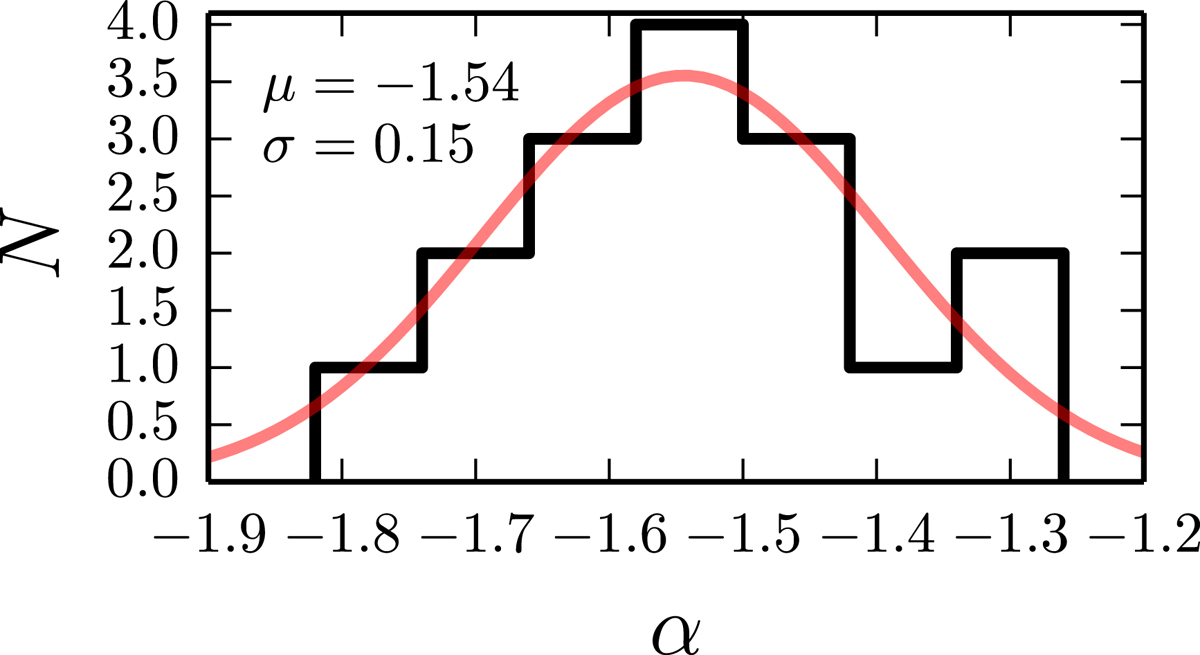
Distribution of a values as compiled from the literature by Parsa et al. (2016) at redshifts z = 2.7 – 4.0. A Gaussian fit to this distribution is shown as a red line and the median and sigma of this Gaussian are labelled in the panel.
Current usage metrics show cumulative count of Article Views (full-text article views including HTML views, PDF and ePub downloads, according to the available data) and Abstracts Views on Vision4Press platform.
Data correspond to usage on the plateform after 2015. The current usage metrics is available 48-96 hours after online publication and is updated daily on week days.
Initial download of the metrics may take a while.