Fig. 8
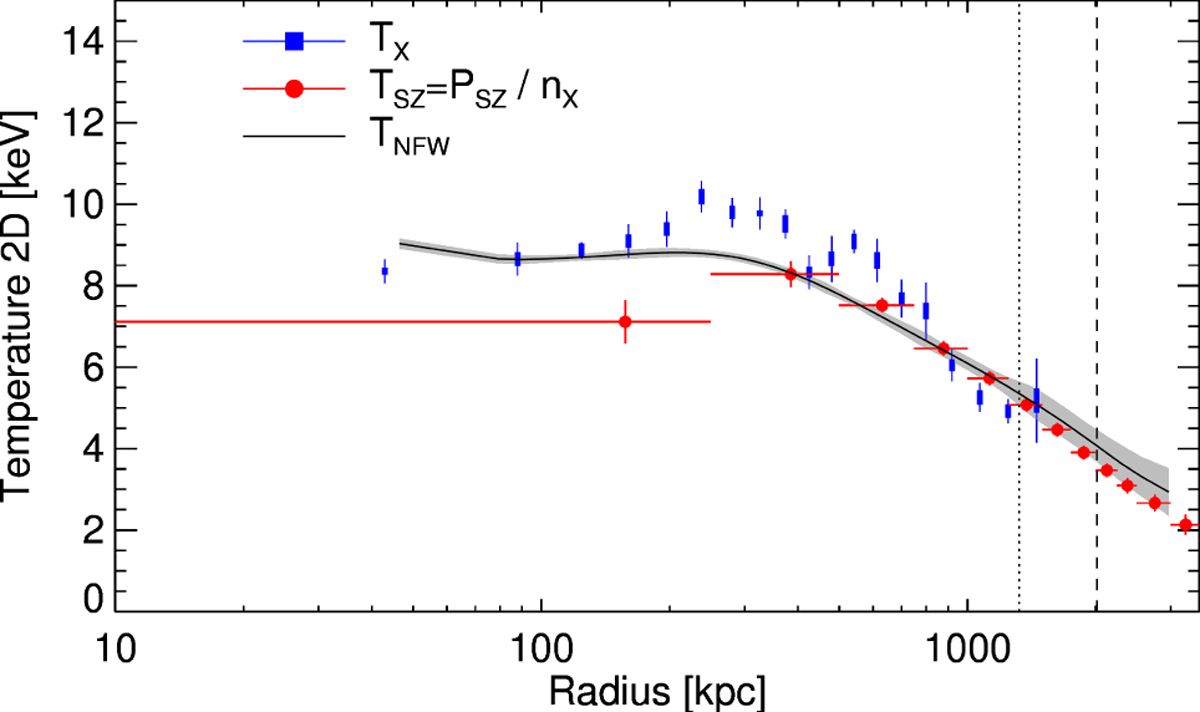
Two-dimensional temperature profiles using X-ray spectral data (blue points; thick error bars represent the systematic uncertainty as estimated in see Sect. “Systematic uncertainties on the temperature profile,” and thin error bars indicate the total uncertainties); the pressure from SZ divided by density from X-ray projected on the plane of the sky (red points); and the projection of the reconstructed temperature from the backward technique, which makes use of both X-ray and SZ data, on an NFW mass model (black line). The grey shaded area is the 1σ confidence region around the backward result. The vertical dotted and dashed line marks the position of R500 and R200, respectively.
Current usage metrics show cumulative count of Article Views (full-text article views including HTML views, PDF and ePub downloads, according to the available data) and Abstracts Views on Vision4Press platform.
Data correspond to usage on the plateform after 2015. The current usage metrics is available 48-96 hours after online publication and is updated daily on week days.
Initial download of the metrics may take a while.