Fig. 7
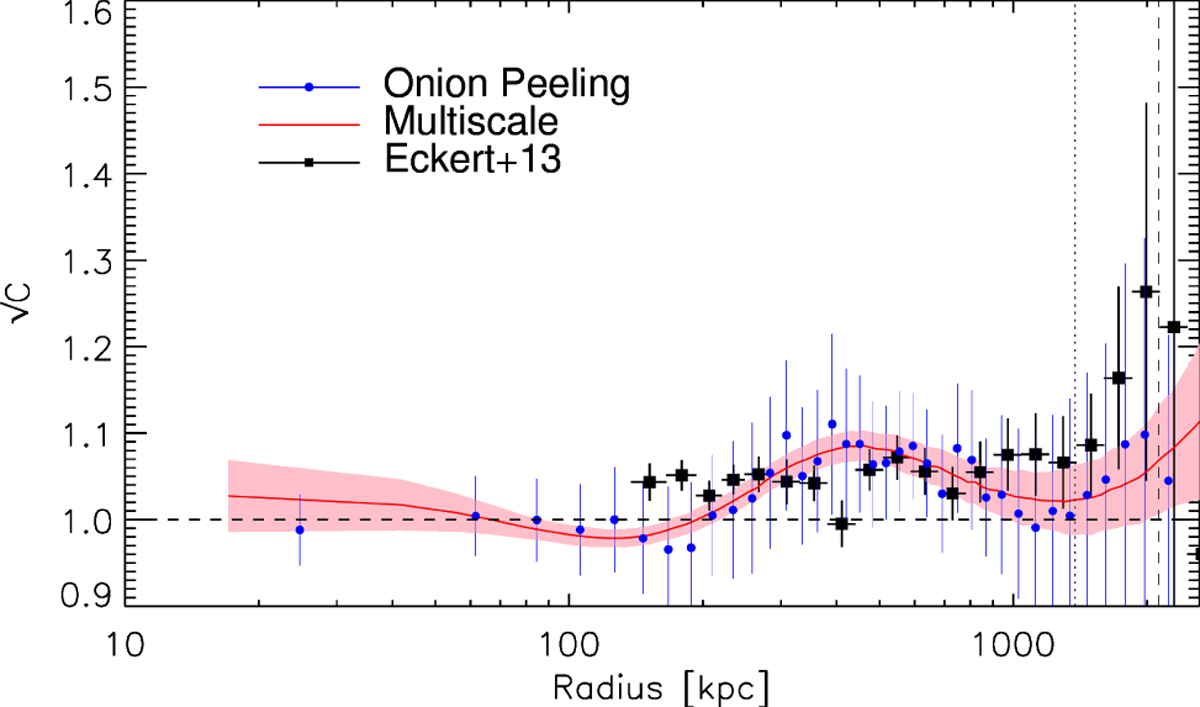
Clumping factor radial profile for both techniques, onion peeling (blue) and multiscale (red). The pink area represents the 1σ confidence interval around the multiscale clumping factor. The black squares represent the observed value for the clumpiness in the work of Eckert et al. (2015). The vertical dotted and dashed line marks the position of R500 and R200, respectively.
Current usage metrics show cumulative count of Article Views (full-text article views including HTML views, PDF and ePub downloads, according to the available data) and Abstracts Views on Vision4Press platform.
Data correspond to usage on the plateform after 2015. The current usage metrics is available 48-96 hours after online publication and is updated daily on week days.
Initial download of the metrics may take a while.