Fig. A.1
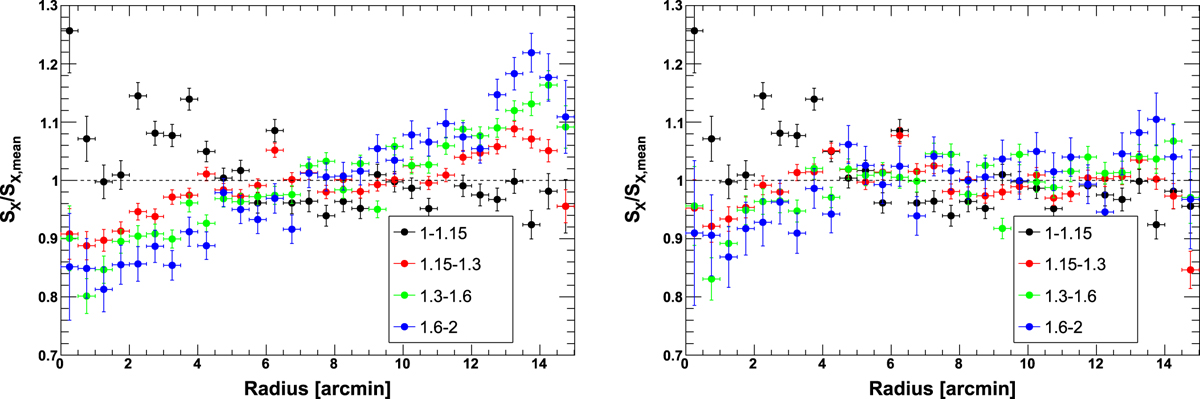
Stacked EPIC radial profiles of 495 blank-sky pointings, sorted in bins of soft-proton contamination inFOV/outFOV. The black data points show observations with low SP contamination (inFOV/outFOV = 1–1.15), whereas the blue points comprise observations that were severely affected by SP contamination (inFOV/outFOV = 1.6–2.0). The left panel shows the stacked profiles obtained when subtracting only the QPB component, while in the right panel, the SP and QC components have been taken into account following Eq. (A.2).
Current usage metrics show cumulative count of Article Views (full-text article views including HTML views, PDF and ePub downloads, according to the available data) and Abstracts Views on Vision4Press platform.
Data correspond to usage on the plateform after 2015. The current usage metrics is available 48-96 hours after online publication and is updated daily on week days.
Initial download of the metrics may take a while.