Fig. 16
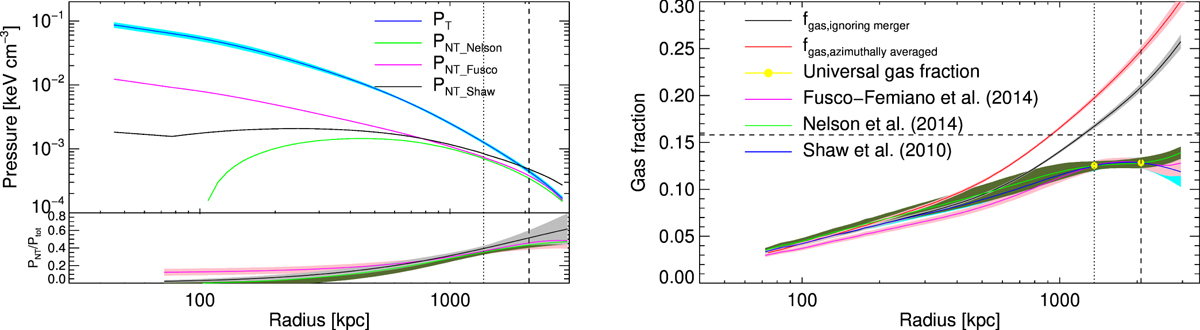
Left: thermal pressure compared with non-thermal pressure using three different models (black, pink, and green lines, Shaw et al. 2010; Fusco-Femiano & Lapi 2014; Nelson et al. 2014, respectively). Right: measured gas fraction profile azimuthally averaged (red line) and ignoring the merging region (black line), and corrected accounting for the contribution of a non-thermal pressure component enabling to match the cosmic gas fraction at R200 and R500. The horizontal line represents the universal baryon fraction (Planck Collaboration XIII 2016), the vertical lines represents the position of R500 and R200, and the yellow points are the universal baryon fraction depleted by the thermalized gas and by the star fraction. The pink, green, and blue lines represent the gas fraction we get by using different functional forms in order to reduce the observed gas mass fraction to the universal one.
Current usage metrics show cumulative count of Article Views (full-text article views including HTML views, PDF and ePub downloads, according to the available data) and Abstracts Views on Vision4Press platform.
Data correspond to usage on the plateform after 2015. The current usage metrics is available 48-96 hours after online publication and is updated daily on week days.
Initial download of the metrics may take a while.