Fig. 15
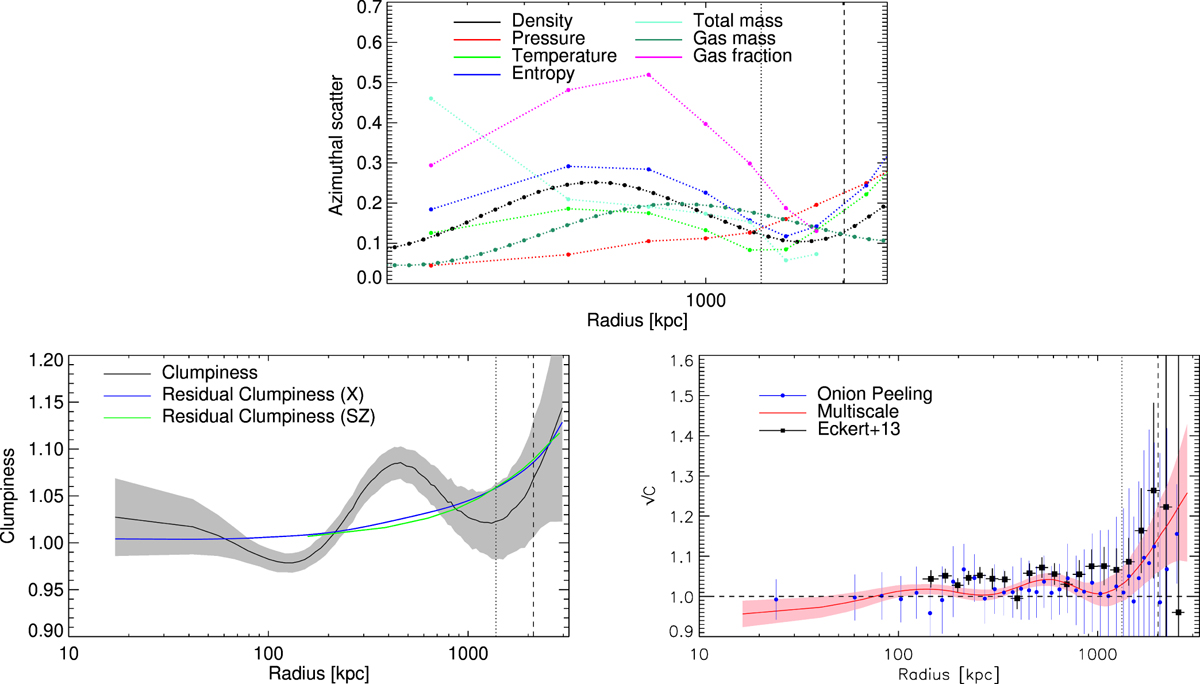
Top:azimuthal scatter in the thermodynamic profiles: gas density and gas mass profiles are obtained from the X-ray spatial analysis; the pressure profile is the result of SZ data analysis; gas entropy and temperature are obtained by combining SZ pressure and X-ray density; the total mass is reconstructed by solving the hydrostatic equilibrium equation using the forward approach. The vertical dotted and dashed line represents the location of R500 and R200, respectively.Centre left: total measured clumpiness (see Sect. 5.2; black line, shaded region represents 1σ uncertainty) compared with the estimated residual clumpiness using X-ray density (blue line) and the SZ Comptonization parameter (green line). Centre right: same as Fig. 7, but removing the problematic sectors (1, 2, and 3) from the analysis. The features present in the whole clumpiness profile disappear almost completely. The dotted and dashed vertical line marks the position of R500 and R200, respectively.Bottom left: total measured clumpiness (see Sect. 5.2; black line, shaded region represents 1σ uncertainty) compared with the estimated residual clumpiness using X-ray density (blue line) and SZ Comptonization parameter (green line). Bottom right: same as Fig. 7, but after removing the merging region in the problematic sectors (1, 2, and 3) from the analysis. The features present in the whole clumpiness profile disappear almost completely. The dotted and dashed vertical line marks the position of R500 and R200, respectively.
Current usage metrics show cumulative count of Article Views (full-text article views including HTML views, PDF and ePub downloads, according to the available data) and Abstracts Views on Vision4Press platform.
Data correspond to usage on the plateform after 2015. The current usage metrics is available 48-96 hours after online publication and is updated daily on week days.
Initial download of the metrics may take a while.